Corrective waves: zigzags, flats and triangles.
Corrective waves are the moves against the trend in Elliott Wave theory, labelled with letters. The three basic shapes are the zigzag (5-3-5, sharp and deep), the flat (3-3-5, sideways, with wave B retracing about 90% of A or more) and the triangle (five legs, A to E, usually narrowing). Corrections can also join into combinations.
本頁目前僅提供英文版。

In the five-wave move from the previous lesson, waves 1, 3 and 5 pushed the trend forward. Waves 2 and 4 were the pauses between them. This lesson is about those pauses, which Elliott Wave analysts call corrections.
Corrections come in more shapes than trend moves, and one shape can turn into another halfway through.
What is a corrective wave?
A corrective wave is a move against the direction of the larger trend. In the impulse waves lesson, waves 2 and 4 were corrective. After a complete five-wave move, a larger correction usually follows.
Corrections are labelled with letters: A, B and C, plus D and E for triangles. The letters keep them apart from the numbered waves of the trend.
Two rules from the impulse still apply. Wave 2 can never move beyond the start of wave 1. In a standard impulse, wave 4 does not move into the price range of wave 1.
Each leg of a correction is built from smaller waves. Analysts describe a pattern by counting them, such as 5-3-5. A 5 means the leg moves in five smaller waves, like a small impulse. A 3 means it moves in three, like a small correction.
How does a zigzag work?
Take an illustrative uptrend in EUR/USD. Wave 1 rises from 1.10000 to 1.12000, a move of 200 pips. Wave 2 then unfolds like this:
- Wave A falls in five smaller waves to 1.11200. That is 1.12000 minus 1.11200 = 0.00800, or 80 pips.
- Wave B bounces in three waves to 1.11600. That is 40 pips, half of wave A.
- Wave C falls in five waves to 1.10800. That is 1.11600 minus 1.10800 = 0.00800, another 80 pips.
- The whole correction is 1.12000 minus 1.10800 = 0.01200, or 120 pips. That is 120 ÷ 200 = 60% of wave 1.
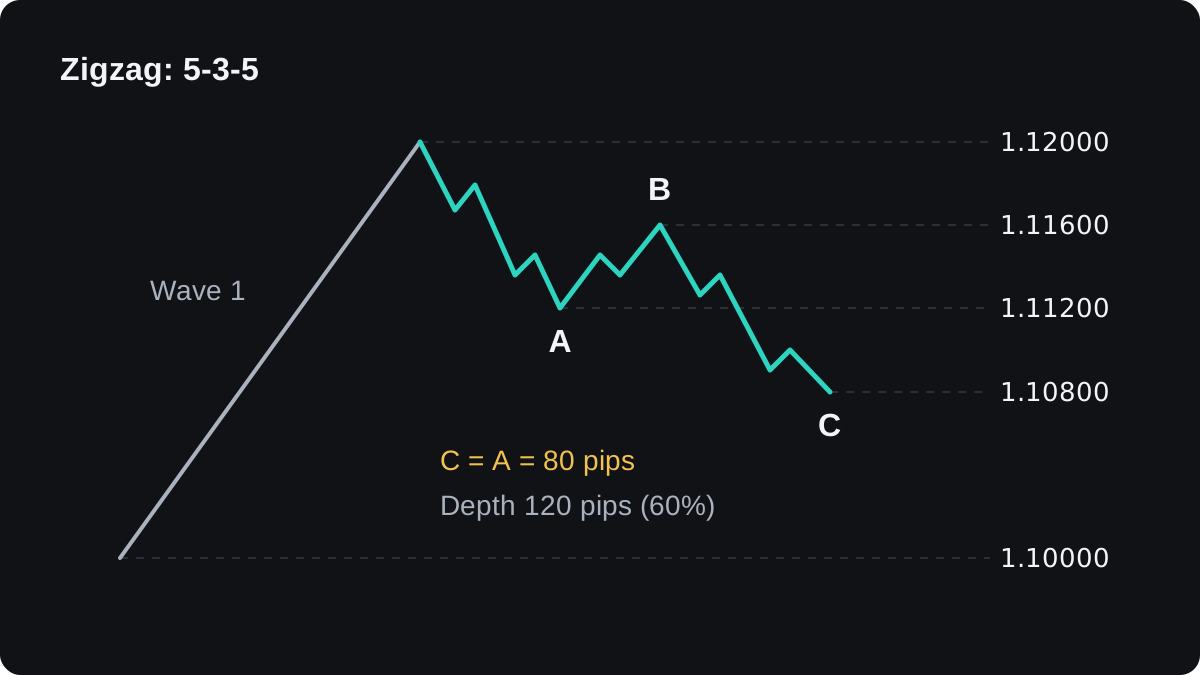
This is a zigzag: a sharp three-leg correction with a 5-3-5 structure. Wave B gets back only part of wave A, so the pattern digs deep into the prior move.
Wave C often comes out close to wave A in length, as it does here. A wave C of about 1.618 times wave A is another common reading, and the Fibonacci retracement lesson covers where those ratios come from. Many zigzags fit neither ratio.
The market sometimes adds a second zigzag, joined to the first by a connecting wave labelled X. The whole move is then called a double zigzag, labelled W, X and Y.
The rules also tell you when the count fails. If price falls below 1.10000, the start of wave 1, this move cannot be wave 2, and the labels have to change.
Why does a flat move sideways?
Continue the same illustrative trend. Wave 3 rises from 1.10800 to 1.15000, a move of 420 pips. Wave 4 then forms differently:
- Wave A falls in three waves to 1.14400, which is 60 pips.
- Wave B climbs in three waves to 1.14950. That is 55 pips, and 55 ÷ 60 = about 92% of wave A.
- Wave C falls in five waves to 1.14350. That is 60 pips, ending 5 pips below the end of wave A.
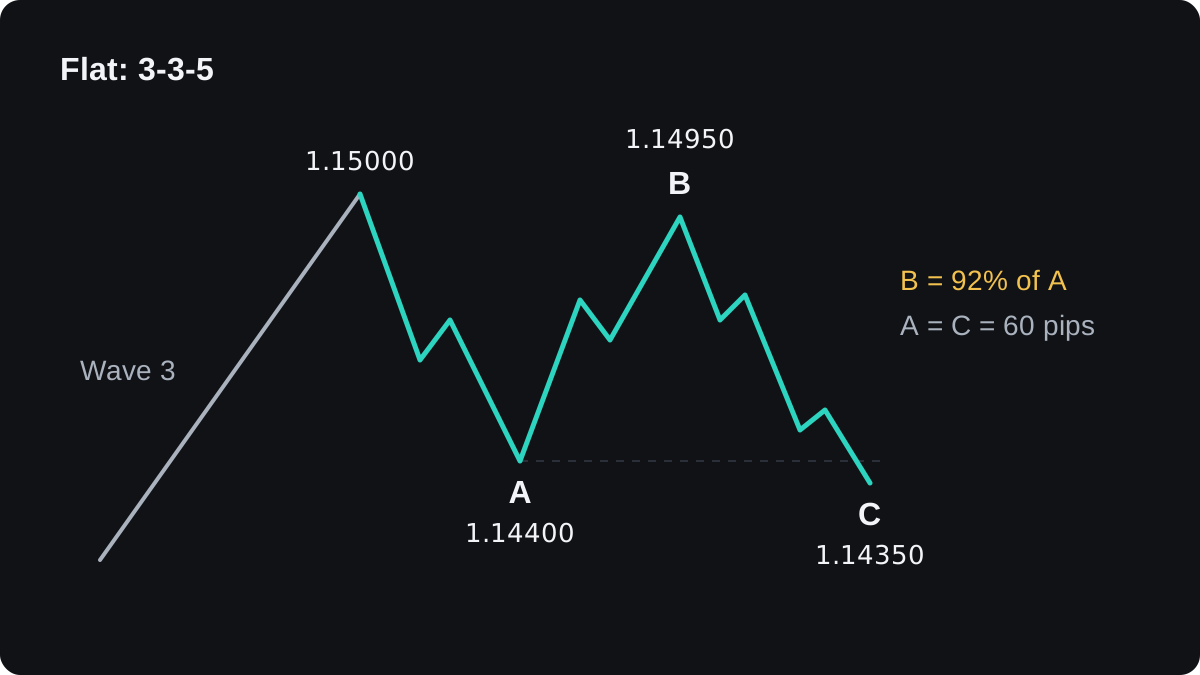
This is a flat, a 3-3-5 correction. Wave B gets back nearly all of wave A, so the pattern drifts sideways. The usual definition asks wave B to retrace at least about 90% of wave A.
Wave 4 bottomed at 1.14350, well above the 1.12000 top of wave 1, so the wave 4 rule holds.
Flats come in three common versions:
- A regular flat has wave B ending near the start of wave A and wave C ending a little beyond the end of wave A, as in the example.
- An expanded flat has wave B going past the start of wave A, for example to 1.15100, and wave C running well below the end of wave A.
- A running flat has wave B going past the start of wave A while wave C stops short of the end of wave A.
The expanded flat is easy to misread, because the new high in wave B looks like the trend restarting before wave C drops sharply.
A running flat is hard to confirm in a different way: wave C stops early, so the pattern can pass for the trend resuming.
How does a triangle form?
This time the illustrative pair is USD/JPY, where a pip is 0.01. Wave 3 tops at 150.00, and wave 1 had topped at 146.00. Wave 4 then moves in five legs:
| Leg | From | To | Size |
|---|---|---|---|
| A | 150.00 | 148.00 | 200 pips |
| B | 148.00 | 149.60 | 160 pips |
| C | 149.60 | 148.40 | 120 pips |
| D | 148.40 | 149.20 | 80 pips |
| E | 149.20 | 148.80 | 40 pips |
Each leg is shorter than the one before. A line through the ends of A and C slopes up, one through the ends of B and D slopes down, and the two lines converge.
This is a triangle, a sideways correction of five legs labelled A to E, with a 3-3-3-3-3 structure. The shrinking version shown here is a contracting triangle. Expanding triangles, where each leg grows, also exist and are less common.
The move out of a triangle is called the thrust. A common guideline puts its size near the widest part of the triangle, here 150.00 minus 148.00 = 2.00, or 200 pips.
Added to the end of wave E at 148.80, that points to about 150.80.
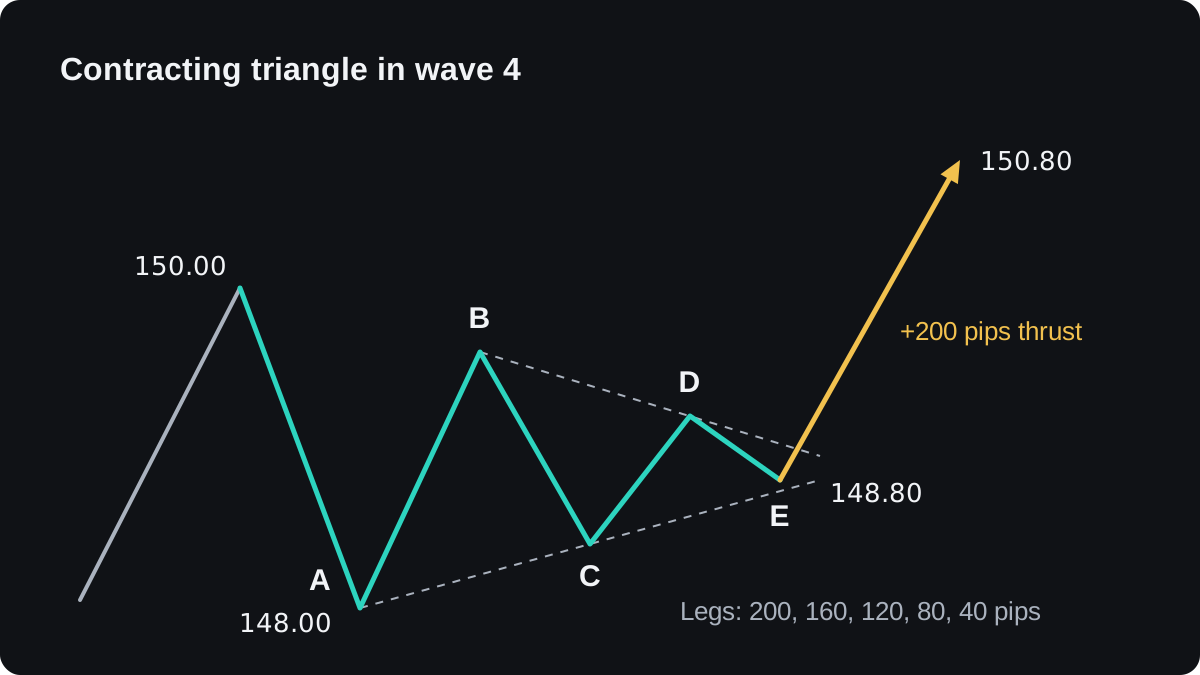
Treat that number as a rough guide. Thrusts are often fast, and many end well short of it.
Triangles tend to appear just before the last move of a larger pattern: wave 4 of an impulse, wave B of an A-B-C correction, or the last part of a combination. Under the standard rules, a triangle does not form as wave 2.
The triangle patterns lesson covers the chart-pattern version of this shape, which does not require five legs or a place in a wave count.
Which correction should you expect next?
The guideline of alternation says waves 2 and 4 of the same impulse tend to differ. If wave 2 is a sharp zigzag, wave 4 is more often a flat or a triangle, and the reverse.
The EUR/USD example follows it. Wave 2 was a zigzag that took back 60% of wave 1. Wave 4 was a flat that took back only 1.15000 minus 1.14350 = 65 pips, which is 65 ÷ 420 = about 15.5% of wave 3.
Alternation is a tendency. It ranks possibilities without telling you which one will happen.
| Pattern | Structure | Wave B | Shape | Common places |
|---|---|---|---|---|
| Zigzag | 5-3-5 | Part of wave A | Sharp and deep | Wave 2, wave A |
| Flat | 3-3-5 | About 90% of A or more | Sideways | Wave 4, wave B |
| Triangle | 3-3-3-3-3 | Shorter than A | Sideways, narrowing | Wave 4, wave B, before the last move |
Simple patterns can also join together. A combination is two or three corrections linked by X waves, called a double three or a triple three. Combinations move sideways and can last a long time, which is one reason counts get rewritten midway.
Where do corrective counts go wrong?
While a correction is forming, you cannot know which pattern it will become. The first two legs of a zigzag, a flat and a triangle can look the same, so the label is often clear only after the move ends.
Two careful analysts can label the same chart in different ways. Because counts are revised as new prices arrive, the theory is hard to test fairly, and published evidence that it predicts prices well is limited.
Hold a count as a working idea with a price that proves it wrong. In the examples, that price was 1.10000 for wave 2 and 1.12000 for wave 4 on EUR/USD, and 146.00 for the USD/JPY triangle.
The lesson on trending and ranging markets gives a plainer check on the same question: is the market still pausing, or has it changed character? The next lesson, trading with Elliott Wave counts, turns these invalidation levels into stops and targets.
常見問題
What is the difference between a zigzag and a flat?
A zigzag is 5-3-5 and sharp, with wave B taking back only part of wave A. A flat is 3-3-5 and moves sideways, because wave B takes back about 90% of wave A or more.
How many waves are in a corrective pattern?
Zigzags and flats have three legs, A, B and C. Triangles have five, A to E. Combinations join two or three simple patterns with X waves, so they have more.
Can a triangle be wave 2?
Under the standard Elliott rules, no. Triangles appear before the final move of a larger pattern, such as wave 4 or wave B, so a triangle in that place means the count needs another look.
Is Elliott Wave reliable?
It describes common shapes in price, but counts are subjective and often change as the move develops. Evidence that it predicts prices well is limited, so use it with clear invalidation levels.
繼續學習
 第 2 章What is Elliott Wave theory?Elliott Wave theory says prices move in repeating patterns driven by crowd mood. A trend unfolds in five waves, three with the trend and two against it, then corrects in three waves labelled A, B and C. The same pattern appears at every scale. Counting waves is subjective, and evidence that it predicts prices is weak.
 第 2 章Impulse waves: the five-wave move.An impulse is the five-wave move that carries an Elliott Wave trend: waves 1, 3 and 5 go with the trend and waves 2 and 4 pull back. It must pass three rules: wave 2 never goes past the start of wave 1, wave 3 is never the shortest trend wave, and wave 4 never enters wave 1's price range.
 第 2 章Trading with Elliott Wave counts.Trading with an Elliott Wave count means using the labels to set three prices: an entry after a correction ends, a stop at the level where the count breaks a rule, and a target from Fibonacci guidelines. Counts are subjective and change often, so the invalidation level matters more than the forecast.

