Simple moving average (SMA).
A simple moving average (SMA) adds the closing prices of the last N candles and divides by N. Each new candle adds one price and drops the oldest, so the line rolls forward. Every price carries equal weight, so one unusually large close lifts the average and moves it again when it drops out.
本頁目前僅提供英文版。

Take the last five closing prices on a chart, add them up and divide by five. The answer is one point of a simple moving average. Repeat it on every new candle and the points join into the smooth line that sits over the price.
The moving average lesson covered what these lines are for. Here you work through the arithmetic of the simplest one, so you can check it by hand and see why it sometimes moves for no visible reason.
How is a simple moving average calculated?
A simple moving average (SMA) is the plain average of the last N prices, where N is the period you set. Charting platforms normally use each candle's closing price, and most let you switch to the open, high, low or a blend.
In one line: SMA = sum of the last N closes ÷ N.
Here are five hourly closes on EUR/USD. The prices are round and illustrative.
| Candle | Close |
|---|---|
| 1 | 1.10000 |
| 2 | 1.10100 |
| 3 | 1.10200 |
| 4 | 1.10150 |
| 5 | 1.10350 |
- Add the closes: 1.10000 + 1.10100 + 1.10200 + 1.10150 + 1.10350 = 5.50800.
- Divide by the period: 5.50800 ÷ 5 = 1.10160.
- The 5-period SMA, written SMA(5), is 1.10160 at candle 5.
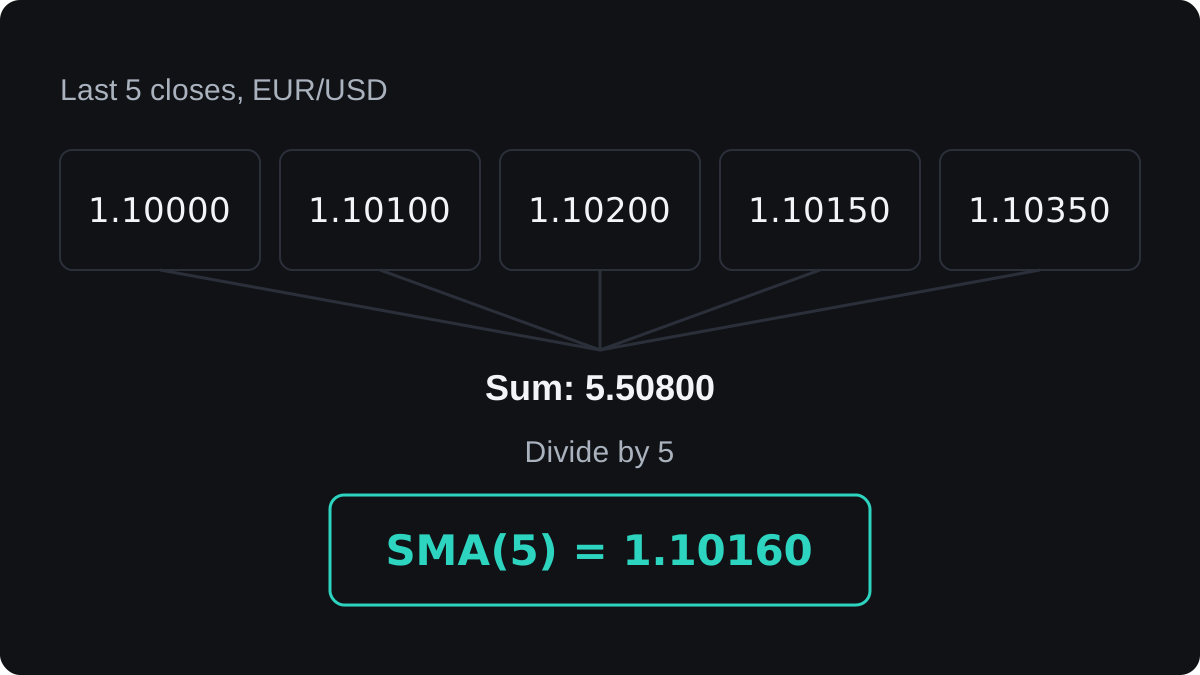
The latest close is 1.10350, so the average sits 0.00190 below it, which is 19 pips. The gap exists because four of the five prices in the window are older and lower.
A chart needs N candles before the first value can exist. That is why a 200-period SMA first appears on the 200th candle of your price history.
How does the SMA move from one candle to the next?
Candle 6 closes at 1.10300. The window slides one step to the right: candle 6 joins, and candle 1 leaves.
- New sum: 5.50800 minus 1.10000 plus 1.10300 = 5.51100.
- New SMA: 5.51100 ÷ 5 = 1.10220.
- The line rose by 0.00060, which is 6 pips.
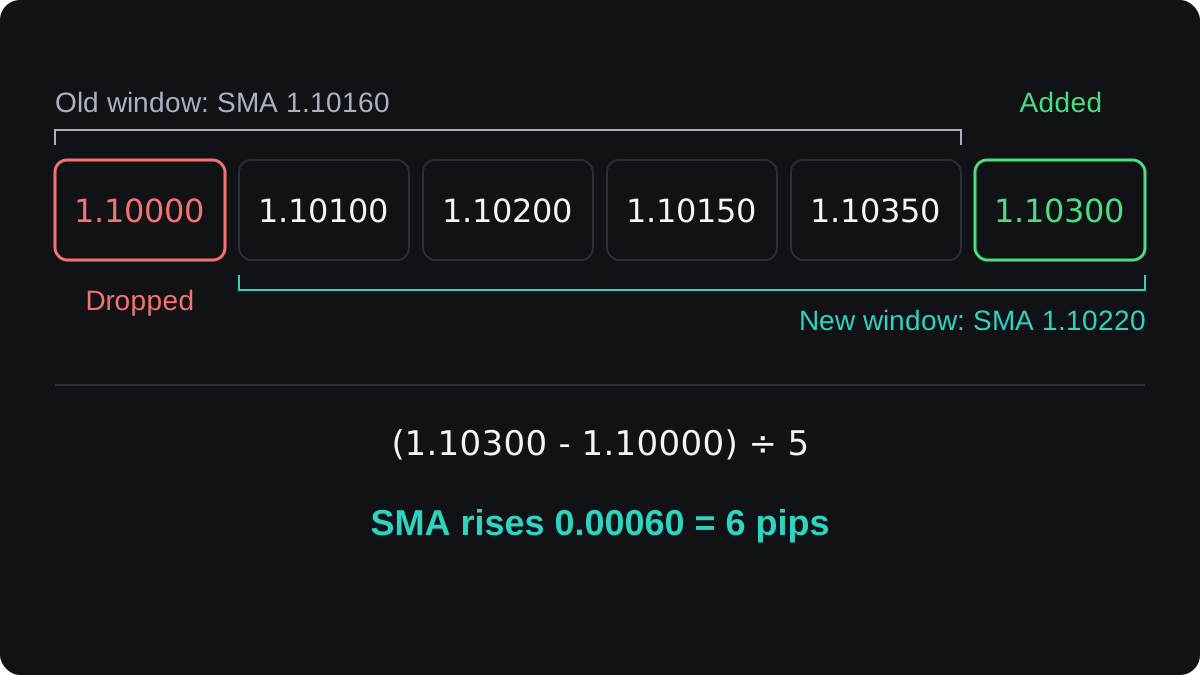
You can skip the full sum. The SMA changes by the new close minus the dropped close, divided by N. Here that is (1.10300 minus 1.10000) ÷ 5 = 0.00060, and 1.10160 + 0.00060 = 1.10220.
The shortcut shows that two prices decide each step: the one arriving and the one leaving. Candle 6 closed 5 pips below candle 5, yet the SMA rose, because the price leaving the window was lower still.
Why can one large price bend the SMA?
Inside the window every close has the same weight, one Nth of the total. An unusual close therefore counts as much as an ordinary one, and it keeps counting for exactly N candles.
Suppose EUR/USD has closed at 1.10000 for many hours, so the SMA(5) is also 1.10000. A news candle then closes at 1.10500, 50 pips higher, and the next candle closes back at 1.10000.
- The spike enters the window: (4 × 1.10000 + 1.10500) ÷ 5 = 5.50500 ÷ 5 = 1.10100.
- The SMA jumps 10 pips, which is the 50 pip spike divided by 5.
- For the next four candles price sits at 1.10000, but the spike is still in the window, so the SMA stays at 1.10100.
- On the fifth candle after the spike, it leaves the window and the SMA falls 10 pips back to 1.10000.
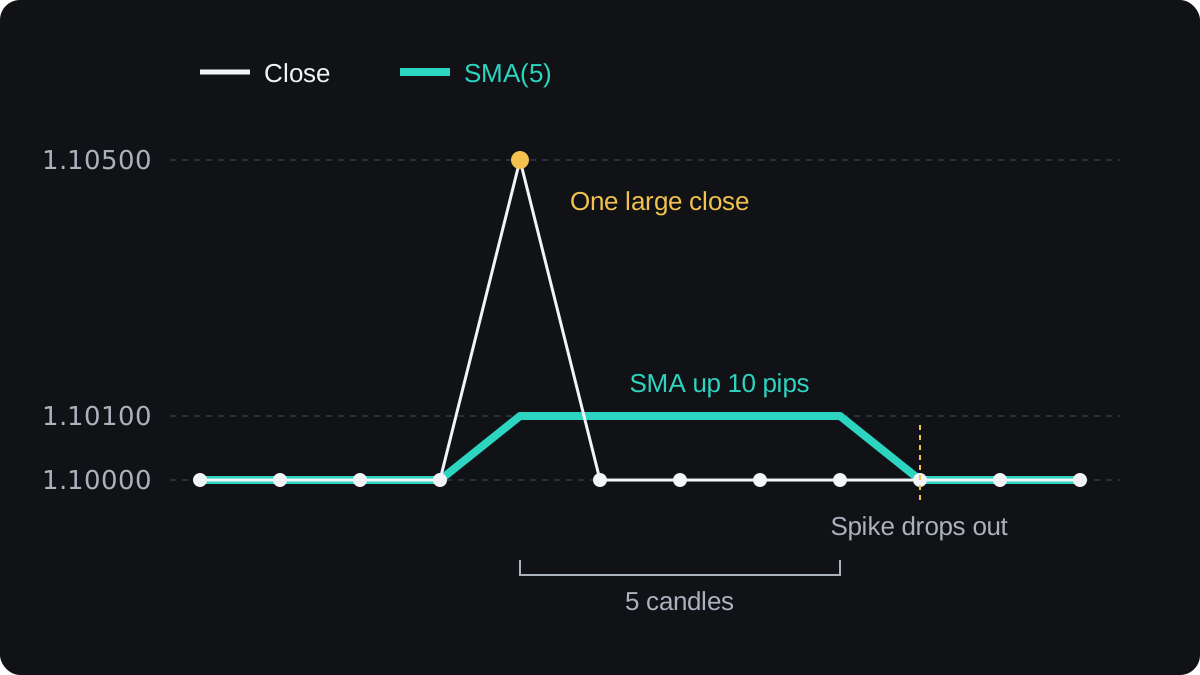
The line moved twice for one event. The second move came on a quiet candle, when nothing happened to price. If an SMA turns while the market looks still, count N candles back and look at the price that just left.
How does the period change the line?
A longer period spreads the same spike over more prices. It also keeps the spike in the window for longer and makes the line slower to follow price.
| Period | SMA move from a 50 pip spike | Candles the spike stays in | Lag behind the latest close |
|---|---|---|---|
| 5 | 10 pips | 5 | 2 candles |
| 20 | 2.5 pips | 20 | 9.5 candles |
| 50 | 1 pip | 50 | 24.5 candles |
| 200 | 0.25 pip | 200 | 99.5 candles |
The lag column shows where the middle of the window sits. The middle of N candles is (N minus 1) ÷ 2 candles behind the latest one, so an SMA(20) is centred on prices from 9.5 candles ago.
Smoothing and delay come from the same averaging, so no period gives you one without the other. A short SMA reacts fast and jumps on odd closes. A long one shrugs off spikes and turns late.
The period counts candles, whatever the timeframe. An SMA(20) covers 20 hours on an hourly chart and 20 trading days on a daily chart. Periods such as 20, 50 and 200 are common by custom, and nothing in the maths makes them special.
Where does the SMA fall short?
Every SMA lags behind price. By the time a 50-period line turns up, price may already have risen for many candles, and part of the move is gone.
In a sideways market price crosses the line again and again. Signals based on those crosses often fail there, which the lesson on trending and ranging markets explains.
Equal weight can also mislead. An SMA(200) gives a close from 199 candles ago the same say as the latest one, and that old price can move the line when it drops out.
The evidence that SMA rules make money is weak. Published tests of moving average and crossover rules give mixed results, and rules fitted to past data often stop working. Test any rule yourself, starting with backtesting, before you trust it.
In MetaTrader, the Moving Average indicator lists Simple as one of its methods, and its Apply to setting picks the input price. Check both, because a line on a different method or price will not match your hand sums.
The exponential moving average gives recent closes more weight, so old prices fade out gradually instead of leaving the window all at once.
常見問題
What is the formula for a simple moving average?
Add the last N closing prices and divide by N. Five closes that sum to 5.50800 give an SMA(5) of 5.50800 ÷ 5 = 1.10160.
Which SMA period is best?
No period is proven best. A short one reacts faster and jumps on odd prices, a long one is smoother and turns later, so pick one that suits your timeframe and test it.
Why did my moving average move when price was flat?
An old price left the window. The SMA changes by the new close minus the dropped close, divided by N, so a large price leaving can move the line on a quiet candle.
What is the difference between an SMA and an EMA?
An SMA weights every close in its window equally. An EMA gives recent closes more weight, so it follows price faster; the SMA or EMA lesson compares them.
Does a simple moving average predict price?
No. It summarises past closes with a delay, so any signal from it is a reading of what already happened.
繼續學習
 第 4 章What is a moving average?A moving average is the average closing price over a set number of recent candles, recalculated every time a new candle closes. Plotted as a line, it smooths out small price swings so the direction of the trend is easier to see. Because it is built from past prices, it always lags behind the market.
 第 4 章Exponential moving average (EMA).An exponential moving average (EMA) is an average of past prices that gives the latest close the most weight. Each period it moves part of the way toward the new price, by a share set by k = 2 ÷ (N + 1). It turns sooner than a simple moving average, but it still lags and gives false signals in sideways markets.
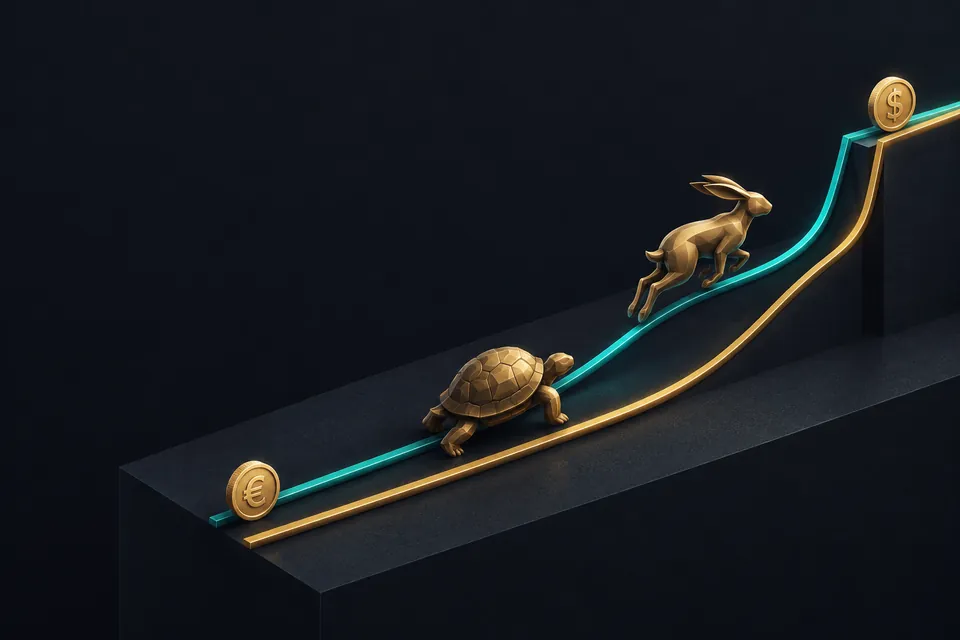 第 4 章SMA or EMA: which should you use?An SMA gives every price in its window the same weight, so it is smooth but slow to turn. An EMA gives the newest prices more weight, so it turns sooner but reacts more to noise. Neither is better in general: choose by the job and test it on your own charts.
 第 4 章Using moving averages to read the trend.A moving average gives two trend readings. Price above the line means the latest close is higher than the average, and price below means lower. The line's slope shows whether the average itself is rising or falling. When both point the same way, the trend reading is clear; when they disagree, it is mixed.
 第 4 章Moving average crossovers.A moving average crossover is the moment a fast moving average crosses a slow one. A cross above is read as a buy signal and a cross below as a sell signal. Because both lines are built from past prices, the signal always comes after the turn, and sideways markets produce repeated false crosses.
 第 4 章Moving averages as dynamic support and resistance.Dynamic support is a moving average that sits below price in an uptrend and keeps rising with it, so pullbacks sometimes pause near the line. Dynamic resistance is the same idea above price in a downtrend. Treat the line as a rough zone. It is most useful in clear trends and often fails in ranges.
 第 4 章Moving averages cheat sheet.A moving average is the average of recent closing prices, recalculated on every new bar. The SMA weights the last N closes equally, and the EMA weights recent closes more, so it reacts faster. Traders use the slope for trend, fast and slow crossovers as signals and the line as moving support or resistance, and every version lags price.

