Stock markets and risk appetite.
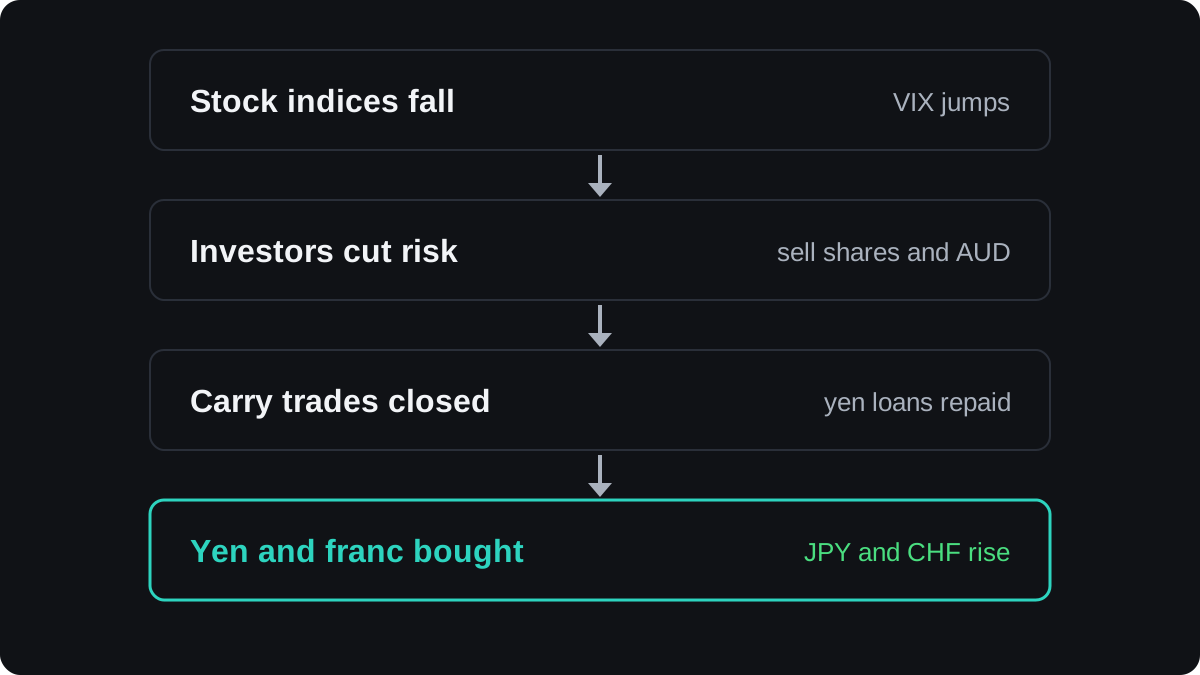
Risk appetite is how willing investors are to hold assets that can fall sharply, such as shares. When stock markets drop, investors often close carry trades funded in low-rate currencies and bring money home. The Japanese yen and Swiss franc then tend to rise, while the Australian and New Zealand dollars fall. This is a tendency, and it sometimes fails.
هذا المحتوى متاح حاليًا باللغة الإنجليزية فقط.

On a day when stock markets drop hard around the world, the Japanese yen and the Swiss franc often climb against most other currencies. The Australian and New Zealand dollars often slide. Traders explain both moves with one idea: risk appetite.
What is risk appetite?
Picture two kinds of market day. On the first, share prices rise and money flows toward currencies that pay higher interest. On the second, share prices fall and investors rush to cut what they hold.
Risk appetite is how willing investors, taken together, are to hold assets that can lose a lot of value. A strong appetite is called risk-on, and a retreat into safety is called risk-off. The risk-on and risk-off lesson looks at the mood itself.
Stock indices are a common reading of that mood, because they are widely followed and update all day. Broad indices such as the S&P 500 in the US or the Nikkei 225 in Japan are the usual references.
A second reading is the Cboe Volatility Index, or VIX. It is calculated from S&P 500 option prices and shows how much movement the options market expects over the next 30 days. It usually jumps when stocks fall sharply.
Why do the yen and the franc rise when stocks fall?
A safe-haven currency is one that tends to gain when investors are frightened. The yen and the franc have earned that label through two main channels.
Carry trades are closed
Say an investor borrows yen at an interest rate close to zero, converts the yen into Australian dollars and deposits them at a higher rate. The interest gap is the profit, as long as the exchange rate holds.
This is a carry trade, and the yen is the funding currency. For long stretches, Japan and Switzerland have had some of the lowest interest rates among major economies, so both currencies are common funding choices.
When stocks fall and prices swing harder, a carry trade can lose more on the exchange rate than it earns in interest.
Investors close it: they sell the Australian dollars and buy back yen to repay the loan. When many do this at once, the yen rises.
Money comes home
Japan and Switzerland are large net creditors. Their residents, companies and institutions own far more assets abroad than foreigners own in those countries. The yen profile covers Japan's side in more depth.
In a scare, some of those owners sell foreign holdings or hedge their currency exposure, and both actions mean buying the home currency. Economists still argue about how large this channel is.
Expectations feed the move as well. Because traders expect the yen and franc to rise on bad news, they buy them early, which helps the rise happen.
Which currencies tend to move which way?
The table sums up the usual pattern. Read every cell as a tendency, with exceptions in each row.
| Measure | Risk-on | Risk-off |
|---|---|---|
| Stock indices | Rise | Fall |
| AUD and NZD | Tend to strengthen | Tend to weaken |
| JPY and CHF | Tend to weaken | Tend to strengthen |
| USD | Mixed | Often strengthens in severe stress |
The Australian and New Zealand dollars are tied to commodity exports and global growth, and they have often paid higher interest rates than the yen. That makes them typical targets for carry money in calm markets.
The largest risk moves usually show up in pairs that join a risk-sensitive currency with a haven, such as AUD/JPY, NZD/JPY or AUD/CHF. Market commentary often quotes AUD/JPY as a rough gauge of risk appetite for that reason.
A risk-off week in pips and dollars
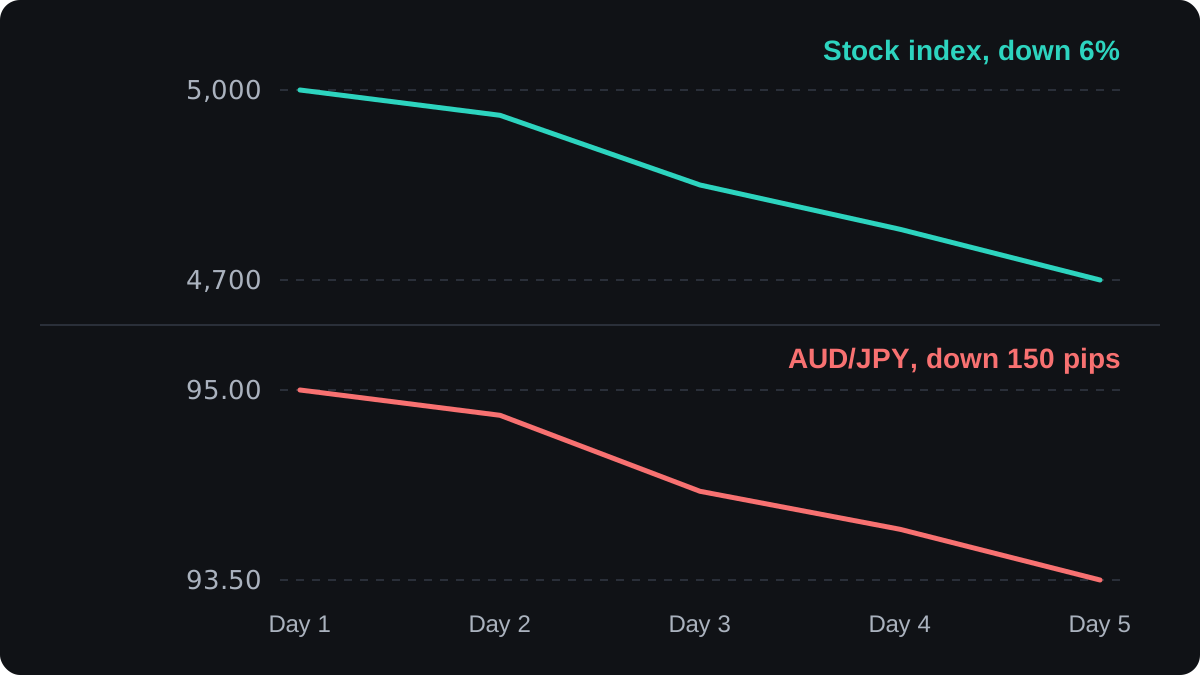
Here is an illustrative five-day sell-off. A stock index falls from 5,000 to 4,700, a drop of 300 points, which is 6%. Over the same days AUD/JPY slips from 95.00 to 93.50, and USD/JPY from 150.00 to 148.50.
Now suppose you held a long position of 0.10 lot of AUD/JPY, opened at 95.00 and closed at 93.50. The prices are round numbers chosen to show the sums, and spread and swap are left out.
- On a JPY pair a pip is 0.01. The move is 93.50 minus 95.00 = minus 1.50, which is 150 pips against you.
- A lot of 0.10 is 10,000 Australian dollars, so each pip is worth 10,000 × 0.01 = ¥100.
- The loss in yen is 150 × ¥100 = ¥15,000.
- In a US dollar account the broker converts at the rate when you close. With USD/JPY at 148.50, the loss is ¥15,000 ÷ 148.50 = $101.01.
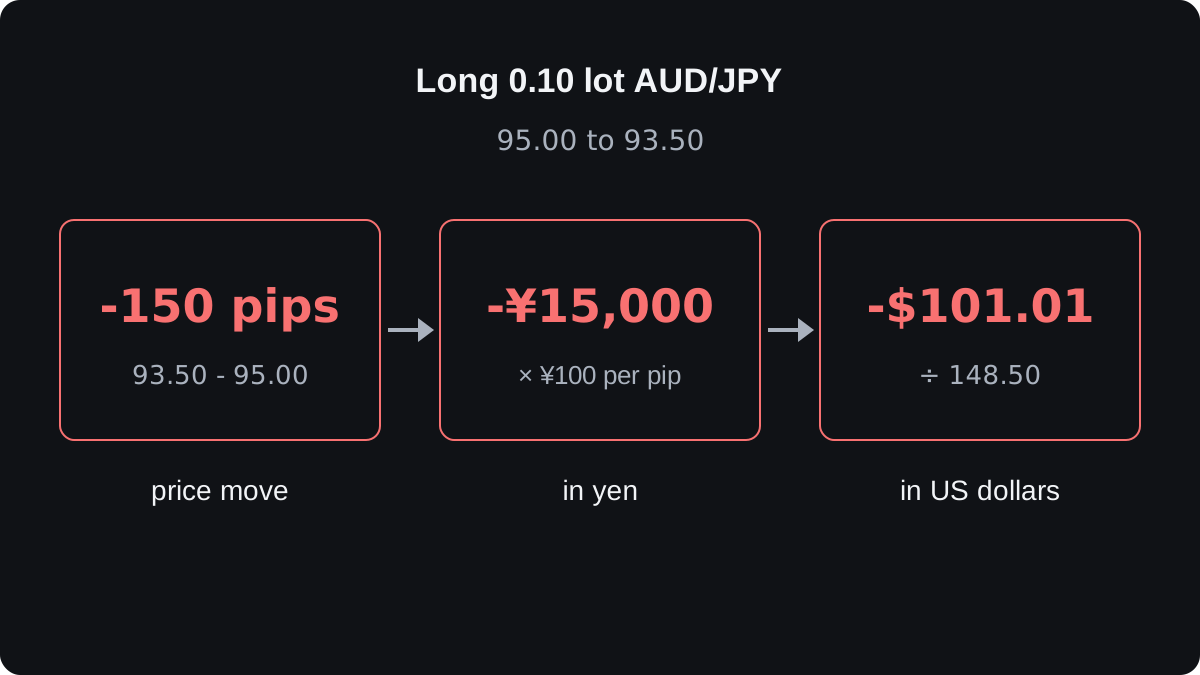
The stronger yen hurt you in two ways: it pushed AUD/JPY down, and it made each yen of loss cost more dollars. At the starting USD/JPY rate of 150.00, the same ¥15,000 would have been $100.00.
A long NZD/JPY position held at the same time would probably have lost on the same days. Pairs that share a haven currency often move together, which is what currency correlation measures. The correlation matrix shows how closely pairs have tracked each other recently.
When does the pattern fail?
The haven pattern is a market habit that has changed over time, so check each case below before you assume it holds.
In a severe scramble for cash, the US dollar can rise against almost everything, at times including the yen and the franc. Much of the world's borrowing is in dollars, so stressed borrowers need dollars quickly. The dollar funding lesson explains why.
Home news can override the global mood. A change in Bank of Japan policy, or a shock inside Japan or Switzerland, can move the yen or franc against the direction that risk appetite suggests.
Governments can lean against the move. Japan's finance ministry and the Swiss National Bank have both acted in the currency market at various times to limit swings in their currencies, including sharp rises.
The strength of the link changes over time. A correlation measured over the past year describes the past year. When interest rate gaps between countries narrow, carry trades shrink, and so does that channel.
Timing is loose as well. Currencies trade around the clock on weekdays while stock exchanges open and close, so the currency move can come before, during or after the stock move.
How can you use risk appetite in your own analysis?
The most practical use is context. Before you open a trade, glance at the main stock indices and the VIX so you know which mood the market is in.
It also exposes hidden overlap. In a risk-off week, a long AUD/JPY trade and a long position on a stock index often fall together, so holding both adds to one risk.
Be careful about turning the pattern into an entry rule. A falling index does not reliably tell you the yen will rise in the next hour, and once the move is obvious on a chart, much of it may already be in the price.
Any rule built on this link needs testing on past and live data before you trust it, because the relationship has shifted more than once.
Stock markets also move currencies through real buying and selling of shares across borders. That channel is the subject of the next lesson, equity flows and currencies.
أسئلة شائعة
Why is the Japanese yen a safe haven?
Japan has long had low interest rates, so the yen is borrowed to fund carry trades that are closed when markets fall. Japan is also a large net creditor, and some money returns home in a scare.
Does the Swiss franc always rise in a crisis?
No. It often does, but a scramble for US dollars, Swiss domestic news or action by the Swiss National Bank can stop or reverse the rise.
What shows risk appetite most clearly?
Broad stock indices and the VIX volatility index are the usual readings. Pairs such as AUD/JPY also tend to fall when the mood turns risk-off.
Is the US dollar a safe haven?
Sometimes. In mild sell-offs its moves are mixed, while in severe stress it has often risen because borrowers worldwide need dollars to repay debts.
Why does AUD/JPY fall when stocks fall?
It pairs a currency that tends to weaken in risk-off, the Australian dollar, with one that tends to strengthen, the yen. Both effects push the pair the same way.