What moves exchange rates?
Exchange rates move when demand for one currency changes against another. In normal markets, the driver that moves prices most often is the expected gap in interest rates between two countries. Growth and inflation matter mainly through what they imply for rates. Risk appetite can take over in a crisis, and trade balances work slowly, over years.
هذا المحتوى متاح حاليًا باللغة الإنجليزية فقط.
An exchange rate is a price. Like any price, it rises when more people want to buy than sell, and falls when the reverse is true.
Fundamental analysis asks why that demand changes. This lesson sorts the main reasons, from the ones that move prices week to week to the slow forces that take years.
Why does an exchange rate move at all?
Picture a Japanese carmaker selling cars in the United States. It earns dollars but pays its workers in yen, so it sells dollars and buys yen. That one order adds a little demand for the yen.
Every exchange rate is built from orders like that. When buyers of a currency outnumber sellers at the current price, the price rises until the two sides balance again.
Trade is only one source of orders. Investors buying foreign bonds and shares, companies building abroad, central banks and speculators all need currency too. These money movements are called capital flows.
Turnover in the forex market is many times the value of world trade in goods. Investment money therefore drives most short-term moves, so the useful question is what makes investors want one currency more than another.
The answer usually comes back to two things: the return investors expect from holding a currency, and the risk they take to get it.
Interest rates: the driver that moves prices most often
Suppose you have 100,000 units of money to park for one year. Deposits in currency A pay 1% and deposits in currency B pay 5%. These rates are illustrative.
- In currency A you earn 100,000 × 1% = 1,000.
- In currency B you earn 100,000 × 5% = 5,000.
- The gap between the two rates, the interest rate differential, is 5% minus 1% = 4 percentage points.
- On 100,000, that gap is worth 5,000 minus 1,000 = 4,000 a year.
Large investors run the same sum with far bigger amounts. When B's rate rises, or is expected to rise, more of them buy currency B to earn it, and that demand pushes B up against A.
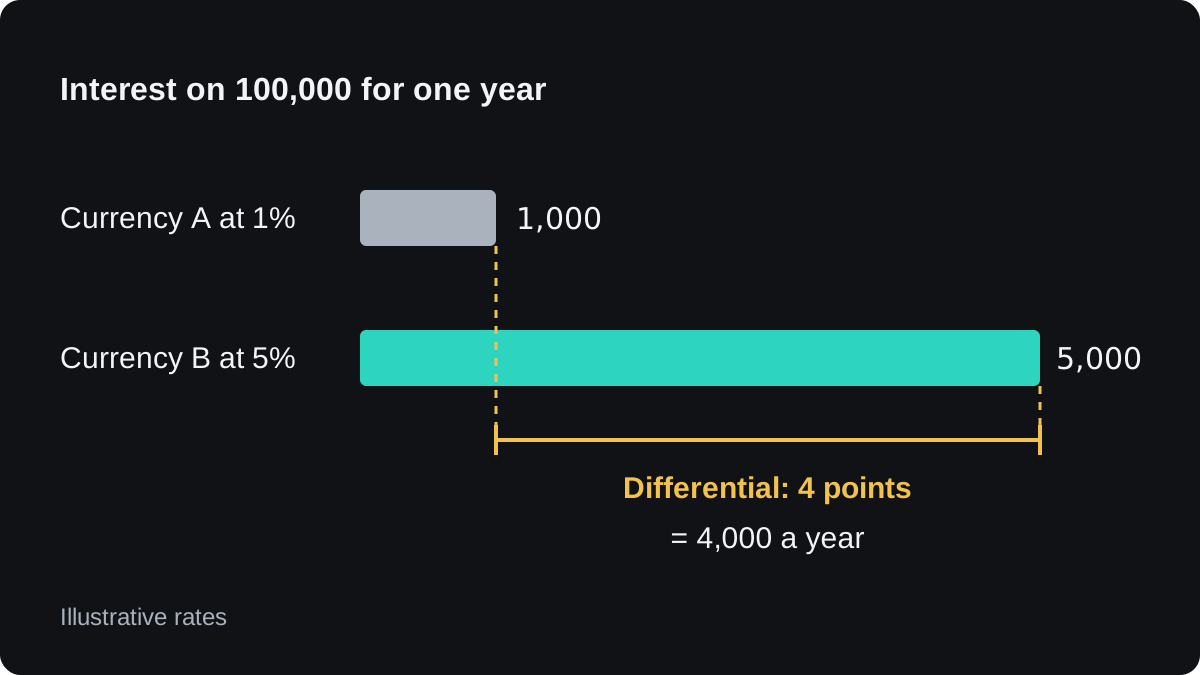
The 4,000 assumes the exchange rate holds still. If currency B falls by about 4% against A during the year, the extra interest is wiped out, and a bigger fall turns it into a loss. That is the main risk of a carry trade.
Markets also trade the expected path of rates more than today's rate. A rate rise that everyone saw coming may barely move the currency, because traders bought it weeks before. The lesson on expectations versus actual results explains why surprises count most.
The next lesson, interest rates and currencies, follows this mechanism in more detail.
Inflation: a slow pull on a currency's value
Inflation can push a currency in opposite directions, depending on how far ahead you look.
Over years, a currency that loses buying power faster than another tends to lose value against it. The idea is called purchasing power parity: the same basket of goods should cost about the same in two countries once you convert the money.
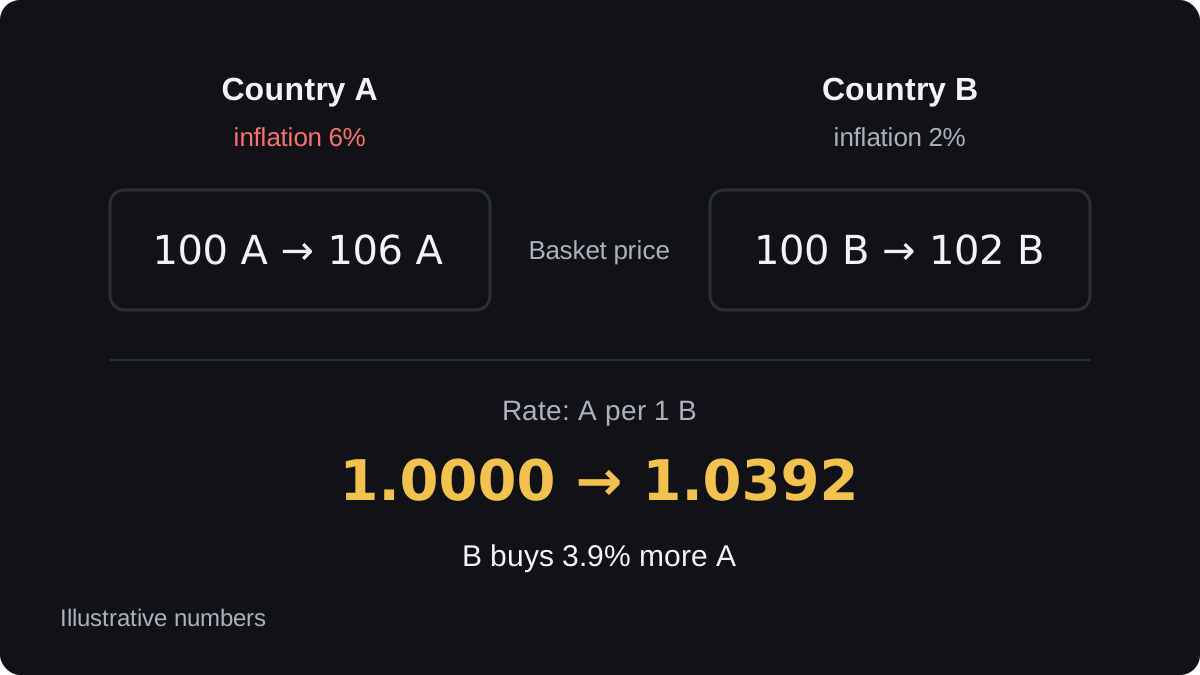
A worked example, with illustrative numbers:
- Today 1 unit of B buys 1.0000 unit of A. A basket costs 100 A in country A and 100 B in country B, so the two baskets match.
- Over a year, inflation is 6% in country A and 2% in country B.
- The basket now costs 100 × 1.06 = 106 A in country A and 100 × 1.02 = 102 B in country B.
- For the baskets to match again, 1 B must buy 106 ÷ 102 = 1.0392 A.
- Currency B now buys 3.9% more of currency A, close to the 4 point inflation gap.
Over months, the effect can run the other way. High inflation often leads a central bank to raise rates, and the higher rate can attract money and lift the currency for a while. The inflation lesson works through both effects.
Purchasing power parity has a weak short-term record. Exchange rates can stay far from it for years, so it says little about where a rate will be next month.
How do growth and risk appetite move a currency?
A fast-growing economy tends to draw investment. Foreign firms build factories there and investors buy its shares and bonds, and each purchase starts with buying the local currency.
Growth also feeds into rates. Strong figures on jobs, spending and output make a rate rise more likely, which is why growth releases on the economic calendar can move a currency within seconds.
Risk appetite can override all of this. In a scare, investors often sell higher-yielding currencies and buy ones seen as safe, such as the Japanese yen or the Swiss franc. This swing is described in risk-on and risk-off.
In those moments a currency with high rates can fall hard. The same investors who bought it for the yield all try to sell at once.
Which forces work more slowly?
A country that exports more than it imports earns foreign currency that is eventually converted back, which supports its own currency. A lasting trade deficit works the other way. These flows are real but steady, and they rarely explain a single day's move.
Politics and government finances work through risk. An election surprise, a budget that worries bond investors or a threat to the central bank's independence can make investors demand a higher return to hold a currency, or sell it.
Central banks can also buy or sell their own currency directly. How well that works varies from case to case, as the lesson on currency intervention shows.
How do these drivers rank against each other?
No fixed ranking exists, and any list is a simplification. A rough order by how often each driver moves prices in calm markets still helps you decide what to watch first.
| Driver | Usual timescale | How it moves a currency |
|---|---|---|
| Interest rate expectations | Days to months | Changes the return on holding it |
| Risk appetite | Hours to weeks | Shifts money between risky and safe currencies |
| Growth data | Days to months | Shifts rate expectations and investment |
| Inflation | Months to years | Moves rates first, buying power later |
| Trade balance | Years | Steady demand from exporters and importers |
| Politics and public finances | Sudden, then lasting | Changes the risk of holding it |
The fast drivers tend to explain daily and weekly moves. The slow ones decide where a currency drifts over years, often with long gaps between cause and effect.
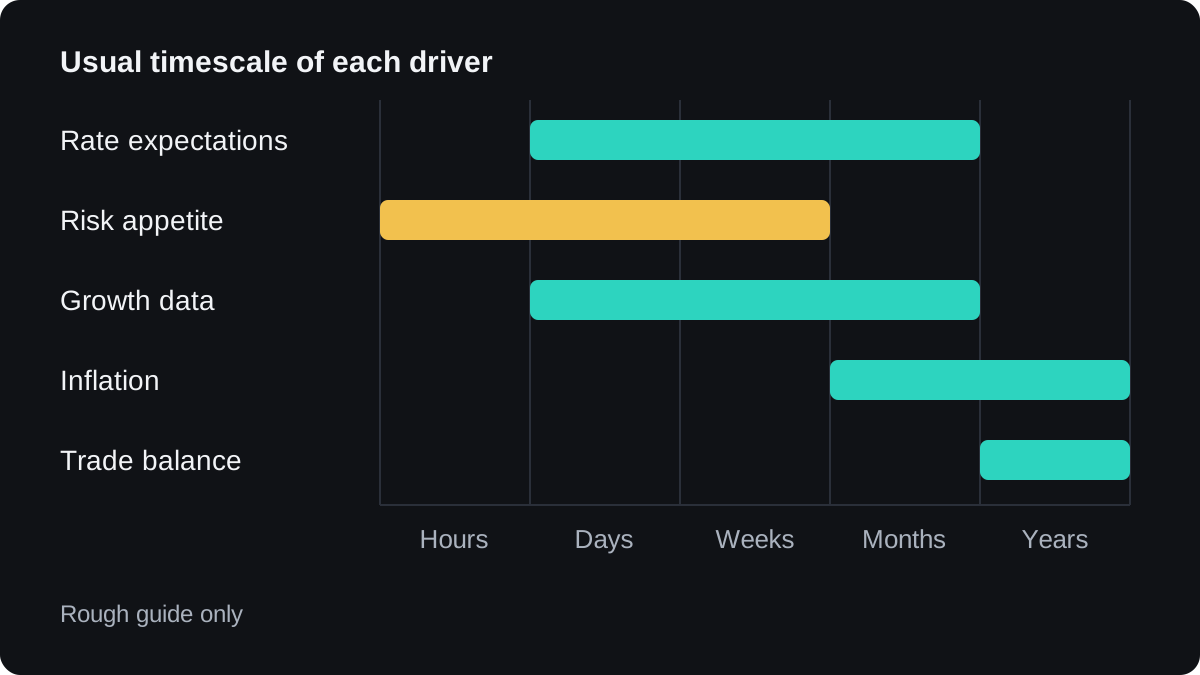
In a crisis, risk appetite can jump to the top and push the rest aside. In calm periods, rate expectations often lead. Because the order shifts, it is worth ranking the drivers again for each period you study.
Be modest about forecasting with any of this. A 1983 study by the economists Richard Meese and Kenneth Rogoff tested standard fundamental models of exchange rates.
At horizons of a year or less, those models forecast no better than simply assuming the rate would not change. Later studies found some exceptions, mostly over longer horizons.
Fundamentals help explain trends, and for timing you can add chart work, as described in combining fundamentals with technical analysis.
أسئلة شائعة
What is the biggest factor that moves exchange rates?
In calm markets, changes in expected interest rates move currencies most often. In a crisis, the rush toward or away from risk can matter more, so no single factor always comes first.
Why does a currency rise when interest rates go up?
A higher rate raises the return on deposits and bonds in that currency, so investors buy it to earn that return. If the rise was already expected, the currency may barely move.
Does high inflation make a currency weaker?
Over years it usually does, because the money buys less. Over months, high inflation can lift a currency if traders expect the central bank to raise rates in response.
Can you predict exchange rates with economic data?
Only loosely. Data helps explain longer trends, but short-term forecasts built on fundamentals have a weak record, so treat any forecast as a probability.
تابع التعلّم
 الفصل 1Interest rates and currencies.A currency tends to rise when its interest rates are expected to go up, because higher rates draw in money looking for a better return. Prices move on expectations, so a hike the market already expected may change little. Inflation and fear can also break the link.
 الفصل 1How central banks move currencies.Central banks move currencies mainly through interest rates. A higher policy rate, or a signal that one is coming, tends to attract money and lift a currency, and a lower one tends to weigh on it. Prices react most to the gap between what the bank does and what markets expected, and guidance and bond buying also move them.
 الفصل 1Inflation and currencies.Inflation moves a currency mainly through interest rate expectations. When an inflation report comes in above forecast, traders expect the central bank to raise rates or keep them higher, so the currency often rises. A figure below forecast often weakens it. Over many years, high inflation that is not controlled tends to erode a currency's value.

