How to read an economic calendar.
An economic calendar lists scheduled data releases with their time, currency and importance rating. Compare the actual figure with the forecast, since prices tend to react to the surprise, and check whether the previous figure was revised. Confirm the calendar's time zone too, because daylight saving can move a US release by an hour on your clock.
Ce contenu n'existe pour l'instant qu'en anglais.

Statistics offices and central banks publish data on a fixed timetable. An economic calendar collects those releases in one list. It shows when each number comes out and what the market expects it to be.
You can open one on this site's economic calendar. The layout in this lesson is typical, though column names differ a little between providers.
What does one row of the calendar tell you?
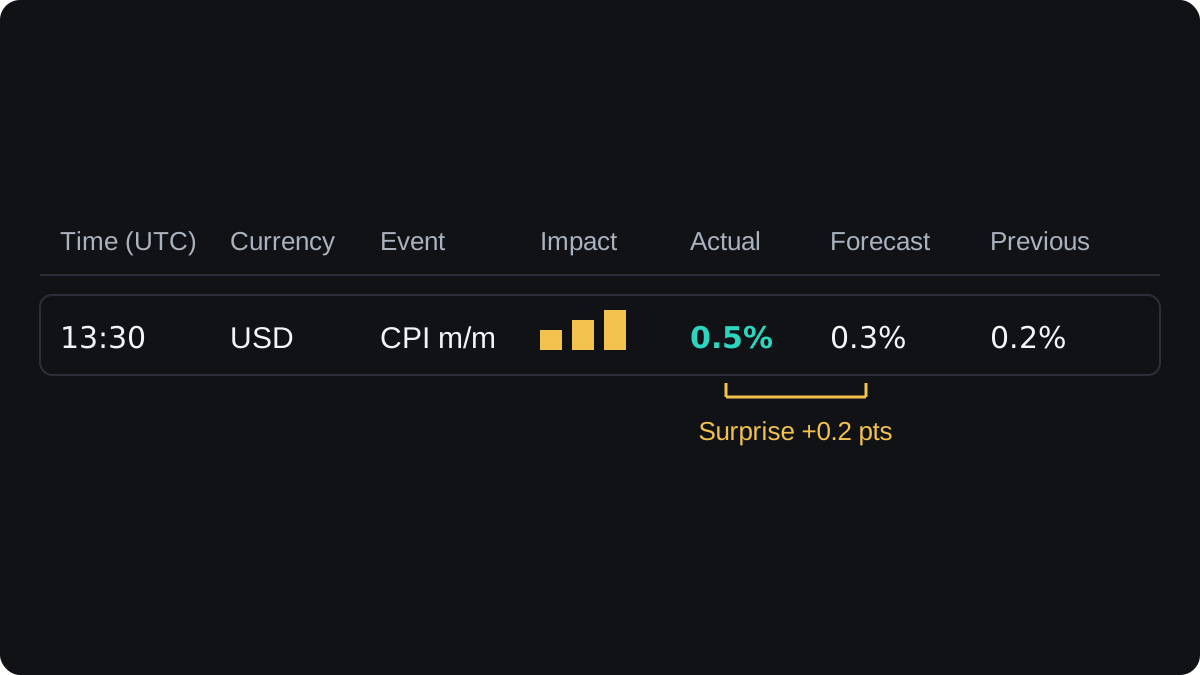
Take one illustrative row. At 13:30 UTC the United States publishes its consumer price index, the CPI, for the month. The calendar marks it USD and gives it the top importance rating.
Three number columns follow. The forecast is the figure the market expects, usually the middle value from a survey of economists. The previous is the last reading, and the actual stays blank until the release.
In this row the forecast is 0.3% and the previous reading 0.2%. The actual arrives at 0.5%, so it beat the forecast by 0.2 percentage points. That gap is the surprise described in expectations versus actual.
How much weight should you give the importance rating?
Calendars usually rate each event on a three-step scale, shown as stars, bars, bull icons or colours. Each provider sets its own rating, often from how much similar releases have moved prices in the past.
Treat the rating as a rough guide. Two calendars can rate the same event differently, and a provider's rating for an event tends to stay the same from month to month.
What the market cares about does change. When a central bank is close to a rate decision, a medium-rated inflation or jobs figure can move a currency more than its rating suggests.
The lesson on market-moving economic data covers which releases tend to matter. Rate decisions and speeches appear as rows too, and a speech has no forecast or actual, so the calendar only tells you when it starts.
How do you read the forecast, actual and previous numbers?
Start with the unit, because one report can fill several rows. CPI is often listed as m/m, the change from last month, and as y/y, the change from the same month a year earlier.
Many calendars also add a core reading that leaves out volatile items such as food and energy. Other short forms are K for thousands and M or B for millions or billions, so a jobs figure of 210K means 210,000 jobs.
Some reports come in stages. A flash or preliminary reading comes out first and a final reading follows weeks later. A final reading that matches the flash often causes little reaction.
Here is the CPI row worked through, with its illustrative numbers:
- Forecast: 0.3% m/m.
- Actual: 0.5% m/m.
- Surprise: 0.5 minus 0.3 = +0.2 percentage points.
- Change from the previous reading of 0.2%: 0.5 minus 0.2 = +0.3 points.
The surprise uses the forecast, and the change uses the previous figure. Prices tend to react to the surprise, since the market already knew the previous number.
Use the term percentage points when you compare two percentages. A move from 0.3% to 0.5% is 0.2 points, which is about 67% higher in relative terms, and mixing the two causes confusion.
Forecasts differ between providers, because each collects its own set of estimates. A release that beats the forecast on one site can match it on another.
Some calendars colour the actual green or red to show whether they read it as good or bad for the currency. That colour is the site's judgement, so check what it means on yours.
Why does the revised previous figure matter?
Many reports correct earlier numbers as new data comes in. The calendar then shows the previous figure as revised, often with a small mark or the old and new numbers side by side.
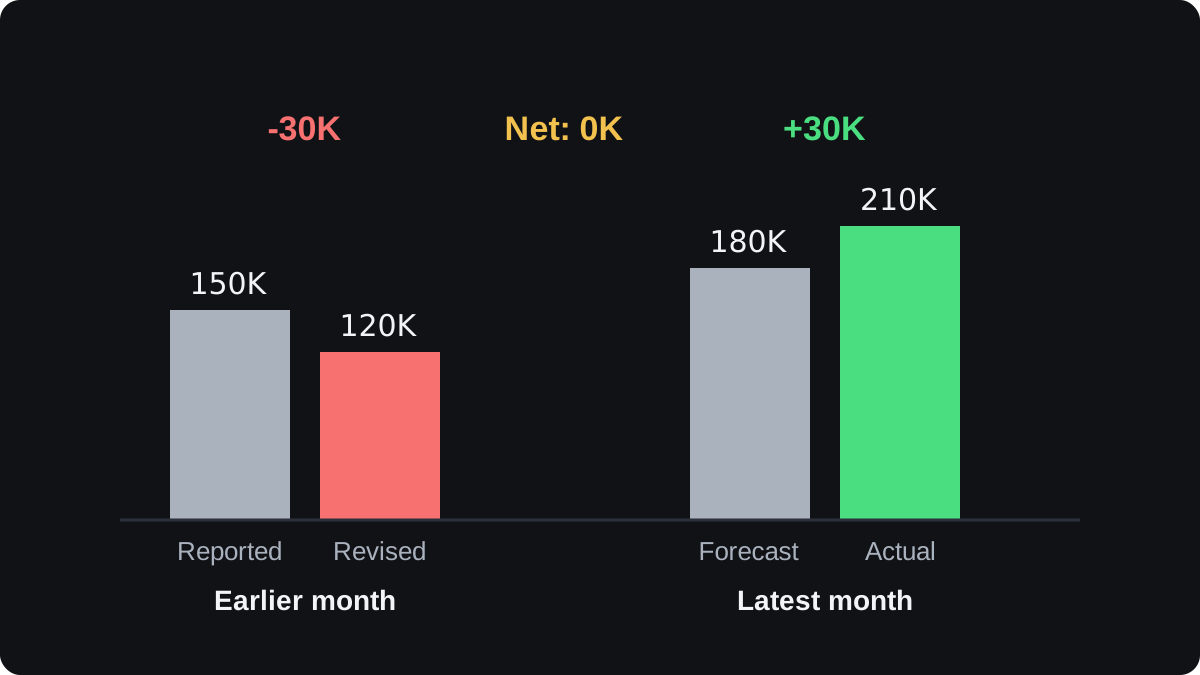
The US monthly employment report is a well-known case, since each release also revises the two months before it. A revision can cancel out a headline surprise, as this illustrative example shows:
- Last month's jobs figure was first reported as 150K.
- This month the forecast is 180K and the actual is 210K, a beat of 30K.
- In the same release, last month is revised down to 120K, a cut of 30K.
- Before the release, the market had 150K plus an expected 180K = 330K jobs.
- After it, the market has 120K plus 210K = 330K jobs.
The headline beat by 30K, yet the two-month total matched what the market expected. A trader who looked only at the actual column would have misread the release.
How do you get the release time right?
Every calendar shows times in one time zone, and that zone is a setting. It may default to your device's clock, to UTC or to a fixed zone.
Your trading platform may run on yet another zone, chosen by the broker. Check the calendar setting once against an event you know. Many US releases, including the CPI and the employment report, come out at 8:30 a.m. New York time.
Daylight saving time moves that release on a UTC clock. New York is five hours behind UTC in winter and four hours behind in summer:
- January: 08:30 in New York + 5 hours = 13:30 UTC. For a trader at UTC+7, that is 20:30.
- July: 08:30 in New York + 4 hours = 12:30 UTC. At UTC+7, that is 19:30.
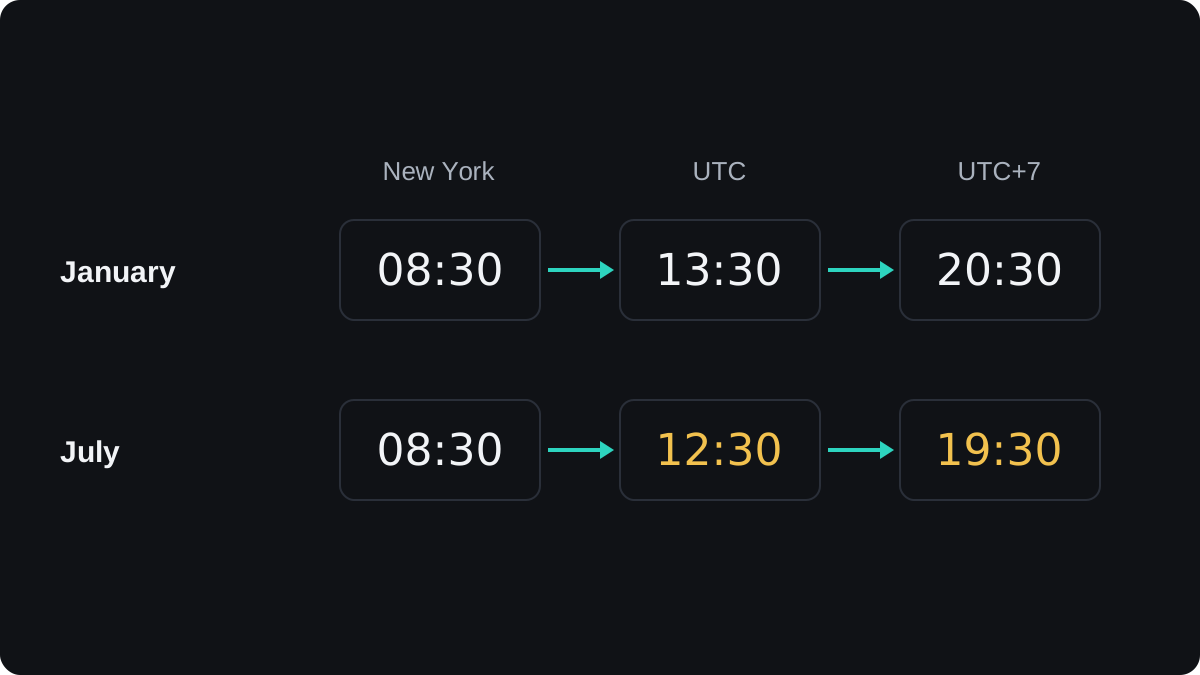
The release stayed at 8:30 for New Yorkers, yet it moved an hour on every clock that does not change. A calendar set to your own time zone handles this for you, provided the setting is right.
Europe and the United States also switch on different dates. For two to three weeks in March, and for one week around the turn of October into November, the usual five-hour gap between London and New York shrinks to four.
During those weeks a US release comes an hour earlier than usual for a trader in London. The market hours tool shows the current offsets.
What should you check before each trading week?
A short check at the start of each week is enough for most uses:
- Confirm the calendar's time zone, and how it lines up with your platform's clock.
- Filter by the currencies in the pairs you trade. A EUR/USD trade is exposed to both euro and US dollar releases.
- Mark the top-rated events, rate decisions and speeches, and note any times shown as tentative.
- Write down the forecast and previous figure for each, so you can compare them with the actual in seconds.
- Check for public holidays, when markets can be thin and spreads wider.
Around a major release, the spread often widens and orders can fill away from the price you saw, which is called slippage. A stop loss can fill worse than its level during a fast move.
The calendar tells you when a number arrives and what was expected. It says nothing about which way price will go, and the first reaction can reverse within minutes, as how markets react to news explains.
Questions fréquentes
What does forecast mean on an economic calendar?
It is the figure the market expects, usually the median of estimates collected from economists before the release. Prices tend to react to the gap between the forecast and the actual figure.
What do the stars or bull icons mean?
They show the provider's importance rating, usually on a three-step scale. Each provider sets it in its own way, so it is a rough guide and can differ between calendars.
What time zone does an economic calendar use?
Whatever its time zone setting says, which may be your device's time, UTC or a fixed zone. Check it against a known event, such as a US release at 8:30 a.m. New York time.
Why did the price fall when the actual beat the forecast?
A downward revision to earlier figures, a weak detail inside the report or positioning before the release can outweigh a headline beat. The calendar row shows only the headline numbers.
Should beginners trade during high impact news?
That is your choice, but know the costs first. Spreads often widen and slippage is more likely, so the same trade can cost more and lose faster than at a quiet time.
Continuer à apprendre
 Chapitre 2The economic releases that move forex.The economic releases that move forex most are jobs reports, inflation (CPI), GDP, retail sales and PMI surveys. They matter because they change what traders expect central banks to do with interest rates. A release mostly moves its own country's currency, and US data reaches furthest because the dollar is on one side of most trades.
 Chapitre 2Expectations versus actual: why surprises move markets.Prices move on the gap between what the market expected and what was published. Before a release, the consensus forecast is largely reflected in the exchange rate. When the actual figure differs, that difference, called the surprise, drives the move. A strong number can still push a currency down if traders expected more.
Courtiers partenaires

