Trading the bounce or the break.
Trading the bounce means buying near support or selling near resistance while the level holds, with a stop just beyond it. Trading the break means entering after price closes through the level, with a stop back inside the old range. Bounce trades fail when the level breaks; break trades fail on false breakouts.
Ce contenu n'existe pour l'instant qu'en anglais.

Price is back at a level you drew last week. It will either turn away from it or push through it, and you can build a trade around either outcome.
Trading the bounce means betting the level holds. Trading the break means betting it gives way. Each one loses in exactly the situation where the other would have won.
What are the bounce and the break?
Support is a price area where falls have stopped before, and resistance is where rises have stopped. The lesson on support and resistance zones drew them as bands a few pips wide, and this lesson uses the same bands.
A bounce trader buys near support or sells near resistance, expecting price to turn back into the range. This is also called fading the level. The stop goes just beyond the zone, where the idea is proven wrong.
A break trader waits for price to move through the zone, then trades in the direction of the move. The stop goes back inside the old range, because a return there means the breakout has failed.
The examples use one illustrative EUR/USD range. Support is the zone from 1.08000 to 1.08100, resistance is the zone from 1.08900 to 1.09000, and every trade is 0.20 lot.
That is 20,000 euros, so one pip is worth 20,000 × 0.0001 = $2.00 in a US dollar account.
How does a bounce trade work?
Price falls into the support zone, trades down to 1.08020 and then closes the candle back up at 1.08150. A close back above the zone is the signal this bounce trader waits for, so you buy.
- Buy at 1.08150.
- Put the stop at 1.07900, ten pips below the bottom of the zone. The risk is 1.08150 − 1.07900 = 0.00250, or 25 pips, which is 25 × $2.00 = $50.00.
- Set the target at 1.08850, just under the resistance zone. The reward is 1.08850 − 1.08150 = 0.00700, or 70 pips, which is 70 × $2.00 = $140.00.
- The reward is 70 ÷ 25 = 2.8 times the risk, a risk-reward ratio of 1:2.8.
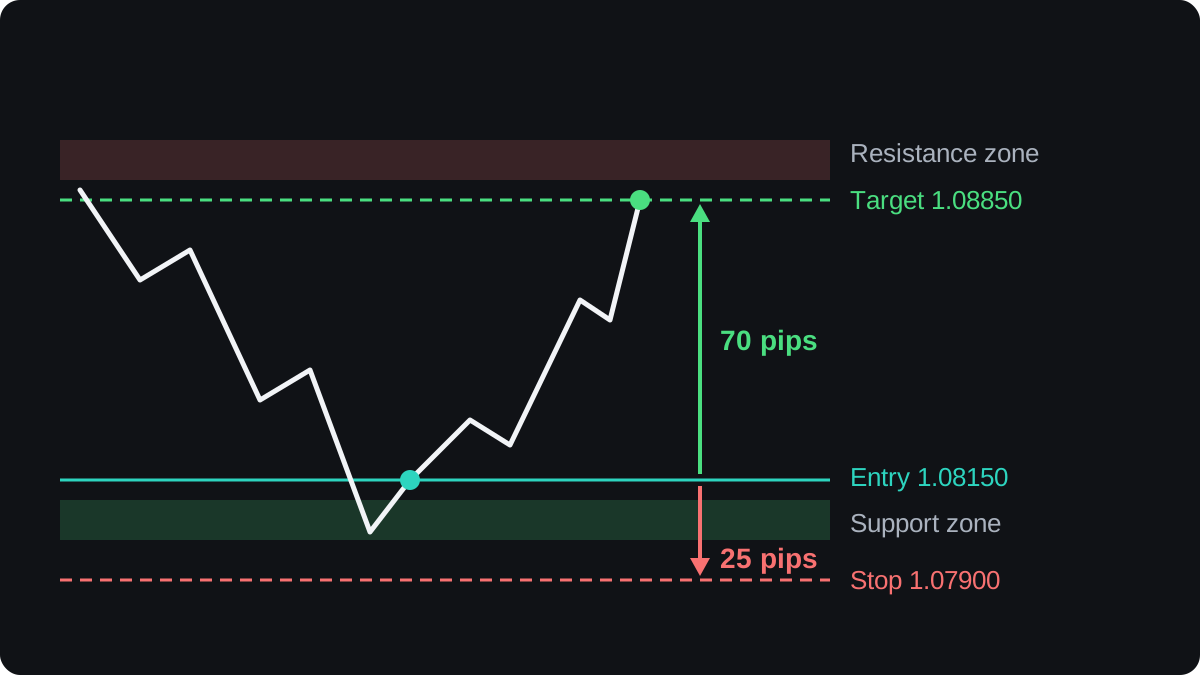
The target sits below the resistance zone because that is where rallies in this range have stalled. Aiming for the middle of the zone asks price to travel into the area where it has turned down before.
The trade fails if support gives way. A drop through 1.08000 that reaches 1.07900 closes the position for a loss of 25 pips, or $50.00.
Selling at resistance mirrors all of this, with one extra trap. A sell's stop triggers on the ask, while many platforms draw the chart from the bid, so a wide spread can hit the stop before the chart line touches it.
Bounce trades suit a market moving sideways. Buying every dip into support while the market falls hard means standing in front of the move, so it helps to tell trending from ranging markets first.
How does a break trade work?
Later, price rallies into resistance for the third time, and a candle closes at 1.09200, 20 pips above the top of the zone. The range has broken upwards, and there are two common ways to enter.
The first is to buy on that close at 1.09200. The second is to wait for a retest, a pullback to the level that just broke, and buy there if it holds.
Broken resistance can turn into support, as the lesson on role reversal explains. Both entries here use the same stop at 1.08850, five pips below the old resistance zone and back inside the range.
For the target, a common rule of thumb adds the height of the range to the breakout level. The range ran from 1.08000 to 1.09000, 100 pips, so the target is 1.09000 + 0.01000 = 1.10000.
That projection is a rough guide with no promise behind it. Price can stop short of it or run far past it.
| Buy on the close | Buy the retest | |
|---|---|---|
| Entry | 1.09200 | 1.09020 |
| Stop | 1.08850 | 1.08850 |
| Risk | 35 pips, $70.00 | 17 pips, $34.00 |
| Target | 1.10000 | 1.10000 |
| Reward | 80 pips, $160.00 | 98 pips, $196.00 |
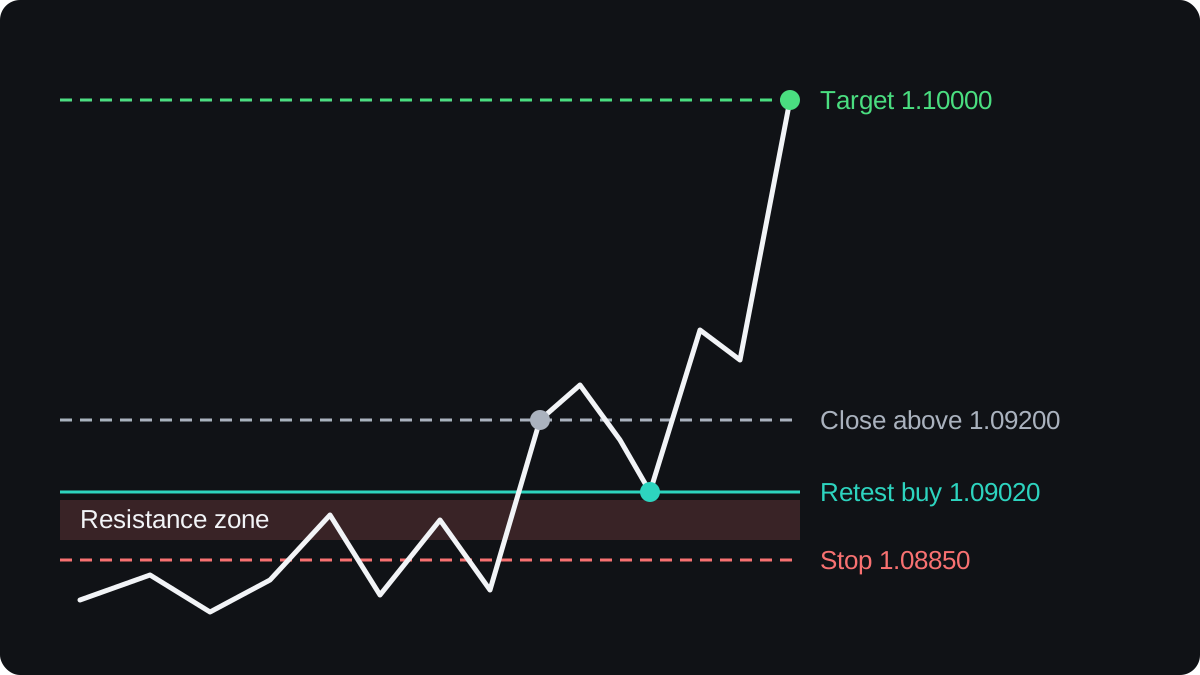
The retest looks better on paper, with less than half the risk and a larger reward. The catch is that price can run on without ever coming back, and then the retest buyer has no trade at all.
Waiting for a candle to close beyond the zone, instead of buying the first tick through it, filters out some brief pokes above the level. It also gives a worse entry price, which is the cost of any confirmation rule.
What happens when a breakout fails?
A false breakout is a move through a level that reverses back into the range. Say you bought the close at 1.09200, and over the next few candles price slides back through the zone to 1.08850.
The stop closes the trade. The loss is 1.09200 − 1.08850 = 0.00350, or 35 pips, which is 35 × $2.00 = $70.00.
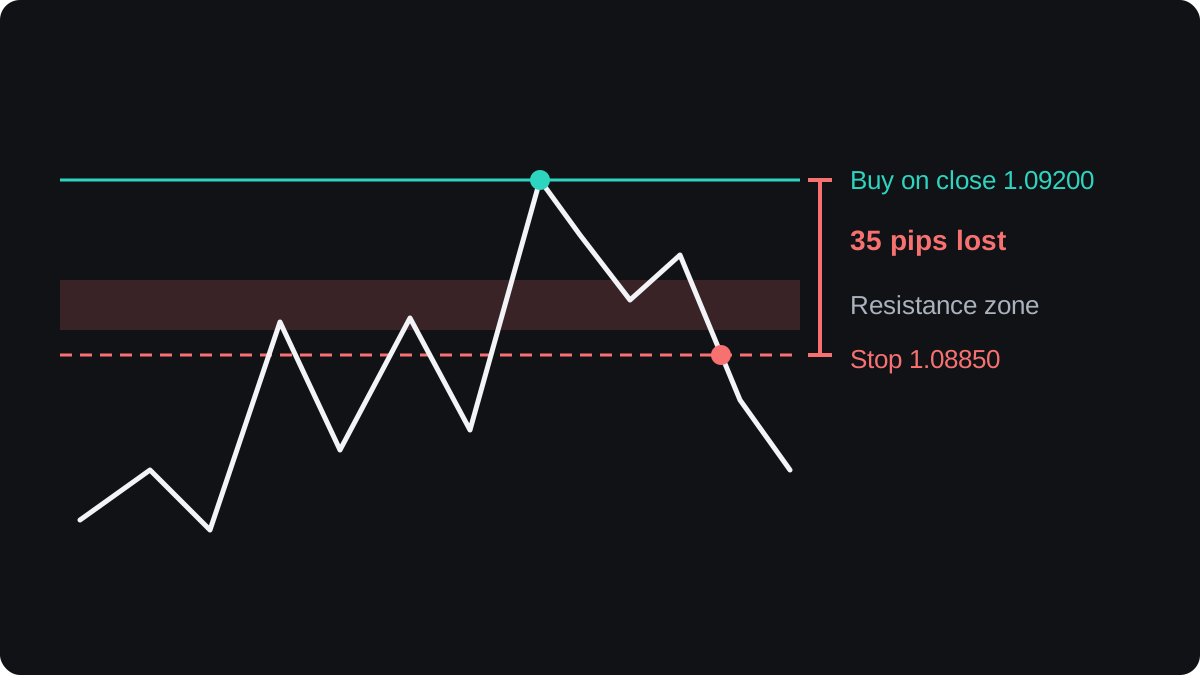
The same poke would also have stopped out a bounce trader who sold at resistance with a stop at 1.09100, ten pips above the zone, even though the level held in the end.
In hindsight, a failed breakout looks like a bounce, and a failed bounce looks like a breakout. Some traders trade the failure itself, selling once price is back inside the range. The false breakouts lesson covers that approach and its own risks.
In every example the size stayed at 0.20 lot, so the money at risk moved with the stop distance, from $34.00 to $70.00.
A common method works the other way round. You fix the amount at risk first, then size the position from the stop distance, so a wider stop means a smaller trade.
How do you choose between the bounce and the break?
No rule tells you in advance whether a level will hold. You read the context and accept that it will sometimes mislead you. These points shape the choice:
- A sideways market with clear turns at both edges suits bounce trades. A market already trending towards the level suits break trades in the direction of that trend.
- Check the higher timeframe. A break of a five-minute level can be ordinary movement inside a daily range.
- Repeated tests of a level can be read both ways, as a level wearing out or as a level that matters. Neither reading has strong evidence behind it.
- Scheduled news can push price through a level and back within minutes, and spreads can widen around the release, so check the calendar before using either method near one.
| Bounce | Break | |
|---|---|---|
| Bets that | the level holds | the level gives way |
| Entry | after a rejection at the zone | after a close beyond the zone, or on a retest |
| Stop | just beyond the far edge of the zone | back inside the old range |
| Fails when | the level breaks | the break reverses |
| Suits | a sideways market | a market trending into the level |
Neither method has a reliable edge on its own. Results depend on the pair, the timeframe, how you draw levels and your costs, so backtest any version before you risk money on it.
Questions fréquentes
Is it better to trade the bounce or the breakout?
Neither is better in general. Bounces suit a sideways market and breakouts suit a market that has started to trend, and both lose when you misread which one you are in.
How can you tell a real breakout from a false one?
You cannot know at the moment it happens. Waiting for a candle close beyond the zone, or for a retest that holds, filters out some false moves at the price of a later entry.
Where do you put the stop on a bounce trade?
Just beyond the far edge of the zone, with a few pips of extra room. In this lesson's example the support zone ended at 1.08000 and the stop sat at 1.07900.
What is a retest in trading?
A retest is a pullback to a level that price has just broken. After an upside break, old resistance is tested from above, and a hold there is the entry some break traders wait for.
Can you trade both the bounce and the break at the same level?
Yes, at different times. You can trade bounces while the range holds and switch to break trades once price closes beyond the zone, as long as your rules say in advance which signal means what.
Continuer à apprendre
 Chapitre 1What are support and resistance levels?Support is a price area where falling prices have stopped and turned up more than once, because buyers stepped in there. Resistance is the opposite: an area where rises have stalled because sellers took over. Traders use both to plan entries, stops and targets, but any level can break, so none is a guarantee.
 Chapitre 1How to draw support and resistance.To draw support and resistance, find swing highs and lows where price turned at about the same price two or more times, then draw a horizontal line through that cluster. Start on the daily or weekly chart for the main levels, refine them on a 4-hour or 1-hour chart, and keep only the nearest few.
 Chapitre 1Why support and resistance are zones, not lines.Price rarely turns at one exact number, because orders spread out around a level and price feeds differ slightly between brokers. Treat support and resistance as a zone: a band from the bodies to the wicks of past reactions. Put your stop beyond the far edge, then size the trade so the risk stays fixed.
 Chapitre 1When support becomes resistance.When price breaks through a support level, that level often acts as resistance when price returns to it, and broken resistance often turns into support. The return visit is called a retest. Traders watch for a candle that reaches into the old zone and closes back on the break side, though the flip can fail.
 Chapitre 1How to draw a trend line.To draw an uptrend line, connect two or more rising swing lows and extend the line to the right. For a downtrend, connect falling swing highs. Two points draw the line, a third reaction is the usual sign it is confirmed, and a candle closing clearly beyond it usually means the line has stopped counting.
 Chapitre 1Price channels and how to trade them.A price channel is two parallel lines that contain a trend: a trend line along the swing lows or highs and a copy on the other side. Near the lower edge a buy aims for the upper edge, and the reverse at the top. A close outside either line can mean the channel has ended.
 Chapitre 1Support and resistance cheat sheet.Support is a price area where falls have stopped before, and resistance is one where rises have stopped. Mark them as zones from clear swing highs and lows, expect broken levels to swap roles, and plan every bounce or break with a stop beyond the zone. Levels show where to watch, and any of them can break.
Courtiers partenaires

