What are support and resistance levels?
Support is a price area where falling prices have stopped and turned up more than once, because buyers stepped in there. Resistance is the opposite: an area where rises have stalled because sellers took over. Traders use both to plan entries, stops and targets, but any level can break, so none is a guarantee.
Ce contenu n'existe pour l'instant qu'en anglais.

On many price charts, the price falls to an area, turns up, and later comes back down to that same area. Traders give those turning areas names.
The area under the price where falls keep stopping is support. The area above it where rises keep stalling is resistance. They are usually the first lines a new chart reader learns to draw.
What do support and resistance look like on a chart?
Take an illustrative EUR/USD chart covering a few weeks. The price drops to about 1.0800 and bounces. It rises to about 1.0900 and turns down. Then it makes the same trip again.
In this example the pair falls to 1.0800 three times and rises to 1.0900 twice. Each move stops at roughly the same place as the one before.
Support is a price area where falling prices have repeatedly stopped and turned higher. Resistance is a price area where rising prices have repeatedly stalled and turned lower.
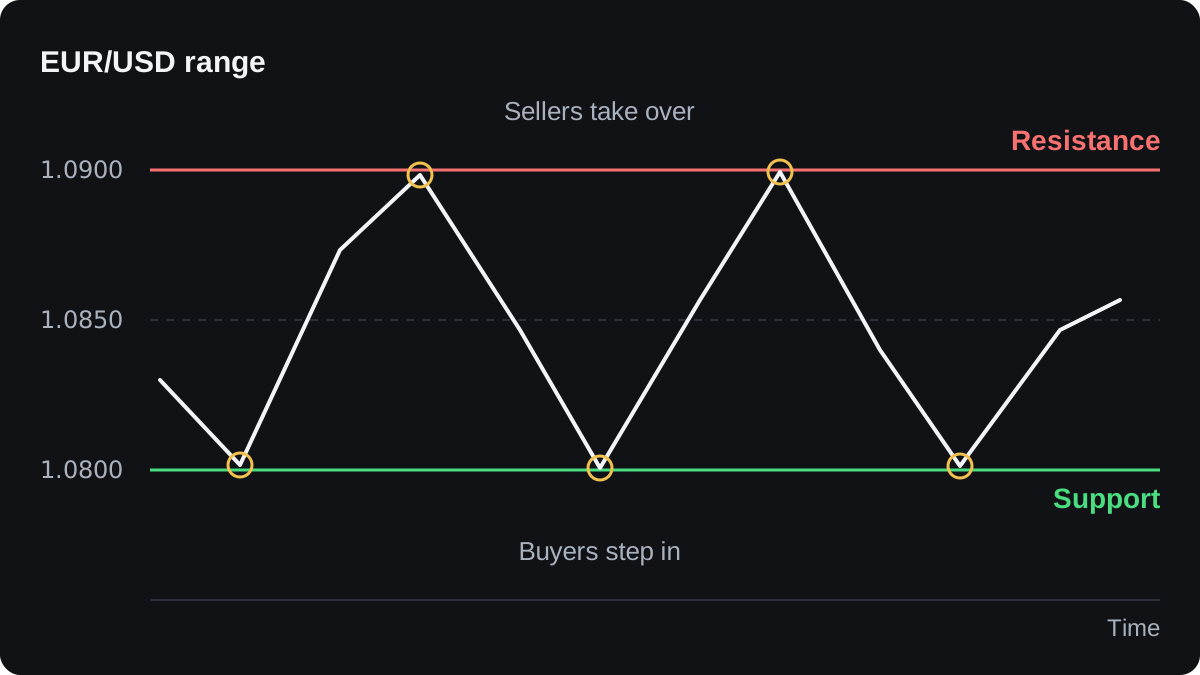
Support sits below the current price and resistance sits above it. When price swings between the two for a while, the market is said to be in a range.
You can mark these levels on any chart type. Candlesticks make them easier to spot, because each candle's wicks show how far price reached before it turned.
Why do prices keep stopping at the same levels?
A line on a chart has no power of its own. Price stalls at a level when enough orders are waiting there to absorb the move, and several habits put orders at old turning points.
Memory is one. Traders who bought at 1.0800 and watched price rise to 1.0900 remember that level. If price returns, some buy again, and traders who missed the first rise may buy too.
Regret works from the other side. Traders who sold at 1.0800 and watched price climb against them may be glad to close near their entry. Closing a short position is a buy order, so it adds to demand at support.
Waiting orders are another source. Pending orders, such as a buy limit at support or a sell limit at resistance, sit in the market before price arrives. Take-profit orders from earlier trades often gather near the same prices.
Stop losses push the other way. A cluster of sell stops just under support turns into selling once price gets through, which can speed up a break.
Round numbers such as 1.0800 on EUR/USD or 150.00 on USD/JPY draw extra attention, because people like tidy prices for their orders. That is one reason the levels in this lesson sit on round figures.
Part of the effect is self-fulfilling. A level matters partly because traders are watching it, and the more widely it is watched, the more orders tend to collect around it.
How exact is a support or resistance level?
Real prices are messy. In the first chart the lows were near 1.0800, and none of them had to land on it exactly. One low might be 1.0797 and another 1.0805.
That is why it helps to think of a level as a band of prices. The lesson on why levels are zones shows how to mark that band.
How wide the band should be depends on the pair and the timeframe. On EUR/USD, a support zone from 1.0790 to 1.0810 is 20 pips wide. On USD/JPY, where a pip is 0.01, a zone from 149.80 to 150.00 is also 20 pips.
Timeframe matters in another way. A level on a daily chart reflects weeks of trading, while one on a 5-minute chart may reflect an hour, so traders usually give the daily level more weight.
What happens when a support or resistance level breaks?
Every level fails at some point. When price closes well beyond support, the buyers who held it have been outnumbered, and price often travels on toward the next level below.
A broken level often changes role. Traders who bought at old support are now losing, and some will sell to get out near breakeven if price comes back, so the area can stall the next rise.
The lesson on when support becomes resistance covers this in detail.
In this illustrative example, EUR/USD breaks below 1.0800 and drops to about 1.0750. It then climbs back to 1.0800, stalls just under it and falls again. That return visit is called a retest.
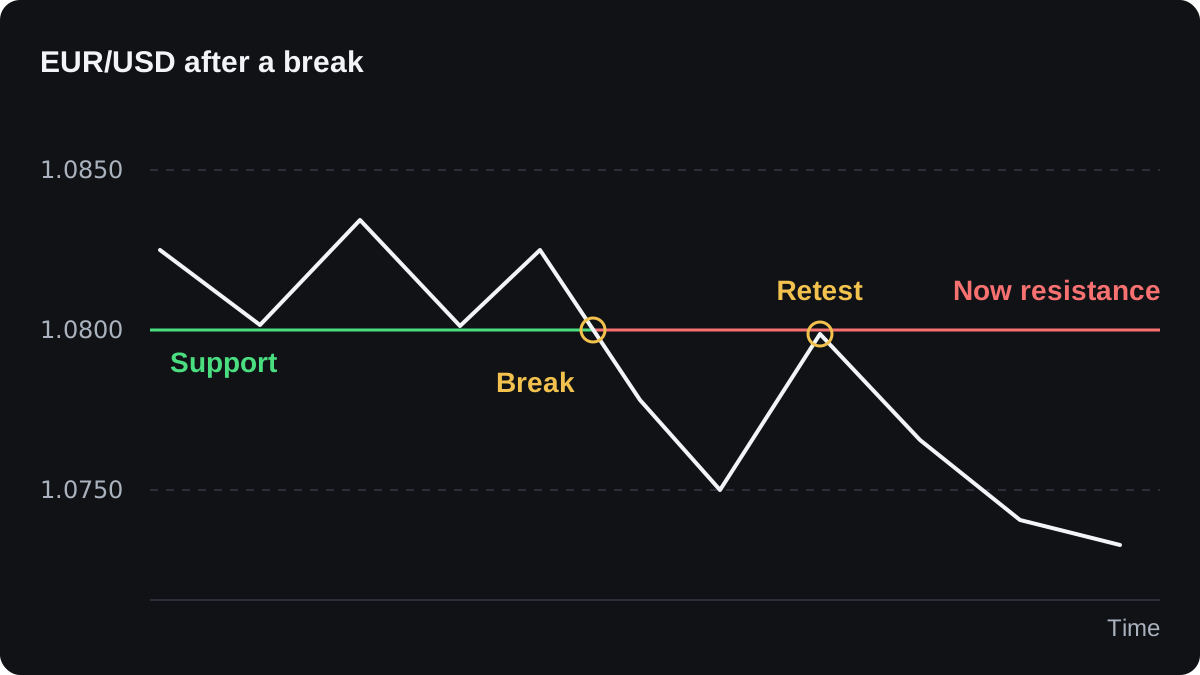
Breaks can also be false. Price may poke through a level, trigger the stop losses gathered just beyond it, and snap back inside the range within a few candles. The lesson on false breakouts covers ways to tell the two apart.
A single wick through a level proves little for that reason. One common filter is to wait for a candle to close beyond the whole zone, and even that filter fails at times.
How can a level shape a trade plan?
Levels give a plan two things it needs: a reason to act at a particular price, and a place where the idea is clearly wrong.
Here is one illustrative plan on the range from the first chart. Support is treated as a zone from 1.0790 to 1.0810 and resistance as a zone from 1.0890 to 1.0910. It shows the mechanics only and is no suggestion to take this trade.
- Place a buy limit order for 0.10 lot at 1.0810, the top of the support zone.
- Put the stop loss at 1.0770, 20 pips under the bottom of the zone, so an ordinary dip into the zone does not close the trade.
- Set the take profit at 1.0890, the bottom edge of the resistance zone, where sellers took over before.
- Risk: 1.0810 minus 1.0770 = 0.0040, which is 40 pips.
- Reward: 1.0890 minus 1.0810 = 0.0080, which is 80 pips.
- On 0.10 lot of EUR/USD a pip is worth 0.0001 × 10,000 = $1, so the plan risks $40 to make $80.
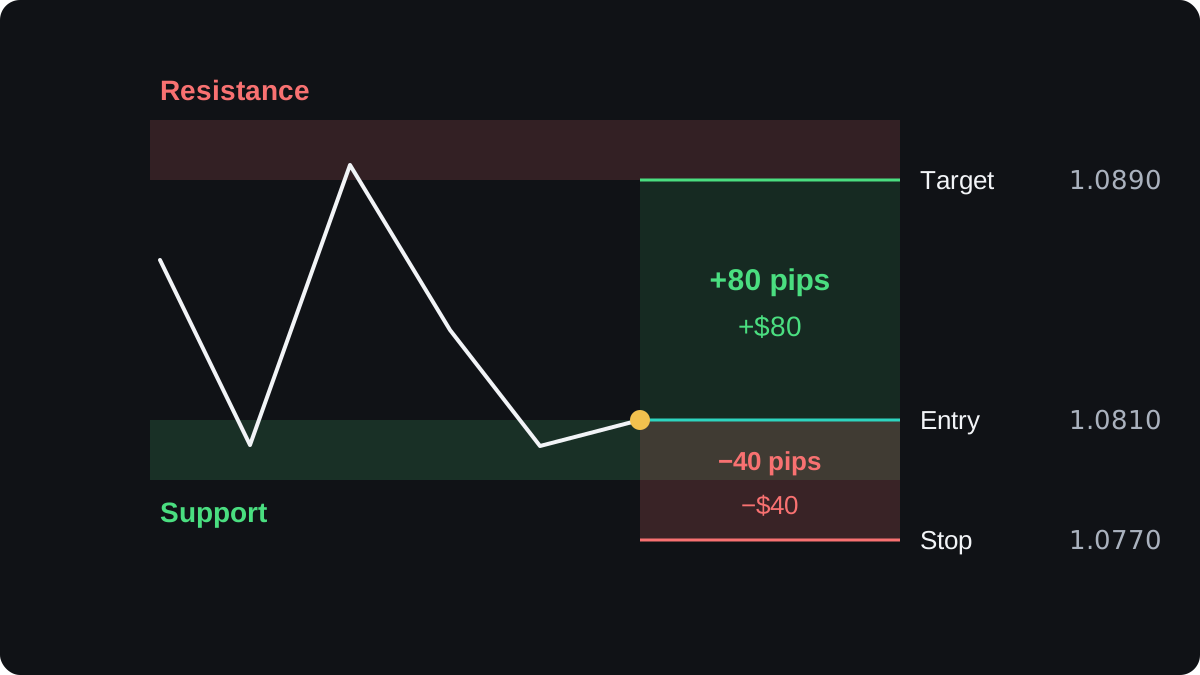
That is a risk-reward ratio of 1 to 2. The ratio says nothing about the chance of each outcome, and support can break before price ever reaches the target.
The spread affects when the order fills. MetaTrader charts show the bid by default, while a buy limit fills when the ask reaches 1.0810, so the chart line has to dip slightly below 1.0810 first.
Notice where the stop sits. A stop placed exactly at 1.0800 would sit with every other obvious stop, where a brief dip through the level can reach it.
How reliable are support and resistance levels?
Support and resistance describe where price has turned in the past. They tell you nothing certain about where it will turn next.
Some academic studies of intraday exchange rates found that prices paused near widely published levels more often than chance would suggest. The effect in that work was modest, and a pause gives no guide to which way price then leaves.
Two people can draw different levels on the same chart, and it is easy to see a level after the fact. Marking levels before price reaches them, and writing them down, is a fair test of what you are really seeing.
Views also differ on repeated tests. One view says each extra touch makes a level stronger. Another says each touch uses up the orders waiting there, so the level weakens. Neither rule holds every time.
The next lesson, how to draw support and resistance, turns these ideas into a step by step method.
Questions fréquentes
What is the difference between support and resistance?
Support is a price area below the market where falls have stopped before. Resistance is an area above the market where rises have stalled before. It is the same idea seen from opposite directions.
Does support and resistance work in forex?
The levels show where price turned before, and because many people watch them, price can pause there. Any level can break, so use them with a stop loss and without assuming the turn will repeat.
How many touches make a support level?
Two clear turns at about the same price are the usual minimum to call it a level. More touches make a level easier to see, but they do not promise it will hold.
Can support become resistance?
Yes. After price breaks below support, that area often stalls the next rise, because traders who bought there sell to get out near breakeven.
Which timeframe is best for support and resistance?
There is no single best one. Levels from daily and weekly charts cover more trading and usually carry more weight, while shorter charts show finer levels for timing an entry.
Continuer à apprendre
 Chapitre 1How to draw support and resistance.To draw support and resistance, find swing highs and lows where price turned at about the same price two or more times, then draw a horizontal line through that cluster. Start on the daily or weekly chart for the main levels, refine them on a 4-hour or 1-hour chart, and keep only the nearest few.
 Chapitre 1Why support and resistance are zones, not lines.Price rarely turns at one exact number, because orders spread out around a level and price feeds differ slightly between brokers. Treat support and resistance as a zone: a band from the bodies to the wicks of past reactions. Put your stop beyond the far edge, then size the trade so the risk stays fixed.
 Chapitre 1When support becomes resistance.When price breaks through a support level, that level often acts as resistance when price returns to it, and broken resistance often turns into support. The return visit is called a retest. Traders watch for a candle that reaches into the old zone and closes back on the break side, though the flip can fail.
 Chapitre 1How to draw a trend line.To draw an uptrend line, connect two or more rising swing lows and extend the line to the right. For a downtrend, connect falling swing highs. Two points draw the line, a third reaction is the usual sign it is confirmed, and a candle closing clearly beyond it usually means the line has stopped counting.
 Chapitre 1Price channels and how to trade them.A price channel is two parallel lines that contain a trend: a trend line along the swing lows or highs and a copy on the other side. Near the lower edge a buy aims for the upper edge, and the reverse at the top. A close outside either line can mean the channel has ended.
 Chapitre 1Trading the bounce or the break.Trading the bounce means buying near support or selling near resistance while the level holds, with a stop just beyond it. Trading the break means entering after price closes through the level, with a stop back inside the old range. Bounce trades fail when the level breaks; break trades fail on false breakouts.
 Chapitre 1Support and resistance cheat sheet.Support is a price area where falls have stopped before, and resistance is one where rises have stopped. Mark them as zones from clear swing highs and lows, expect broken levels to swap roles, and plan every bounce or break with a stop beyond the zone. Levels show where to watch, and any of them can break.
Courtiers partenaires

