Building a fundamental view of a currency.
A fundamental view is a written judgement of whether an economy's data favour its currency. A simple method scores three pillars, growth, inflation and central bank policy, from -2 to +2 each, based on direction and surprises. Comparing two totals shows which currency the data lean toward, though prices often move for other reasons.
Konten ini baru tersedia dalam bahasa Inggris.

Picture two economies. In the first, jobs are growing, prices are rising faster than the central bank wants, and the bank is hinting at another rate rise.
In the second, unemployment is climbing and the central bank has just cut rates. On that data alone, the first currency looks the firmer of the two.
A fundamental view is that judgement written down: a short, dated note saying whether an economy's data favour its currency, and why. This lesson builds one by scoring growth, inflation and central bank policy.
Why turn a fundamental view into a score?
Economic news arrives every day, and it is easy to remember only the reports that fit what you already think. A fixed score makes you check the same few things for every economy, in the same order.
It also lets you compare. A currency only rises or falls against another currency, so a view of one economy means little until you set it beside a second.
The score summarises what the data say. It is a starting bias for fundamental analysis, and it does not tell you what the price will do tomorrow.
Which three pillars do you score?
A pillar is one area of the economy that you score on its own. Three are enough for a first view, because each one feeds into interest rates, one of the main links between an economy and its currency.
Growth
Growth asks whether the economy is speeding up or slowing down. The usual readings are GDP, the jobs report and unemployment rate, business surveys such as PMIs, and retail sales.
Faster growth tends to support a currency, because it draws in investment and gives the central bank room to keep rates high.
Inflation
Inflation matters mainly through the central bank. Many central banks of large economies aim for inflation of about 2% a year, so you ask where inflation sits against that target and which way it is moving.
Inflation above target and rising puts pressure on the bank to keep rates high, which tends to support the currency in the short run. The inflation lesson covers the longer-run effect, where high inflation erodes what a currency buys.
One exception: if inflation is very high and the central bank is not fighting it, score inflation as negative. That combination usually weakens a currency.
Policy
Policy is the central bank's interest rate and, above all, its expected direction. Markets price expected rate moves before they happen, so the bank's guidance about its next steps often matters more than today's rate.
Higher rates tend to attract money into a currency. The interest rates lesson explains why.
How do you turn the data into a score?
Score the direction and the surprise, and give less weight to the level. Growth of 3% that everyone expected tells you little, while a fall from 3% to 2%, or a release well below forecast, tells you more.
That is because prices already reflect what traders expect. The lesson on expectations versus actual shows how a surprise moves a market.
Give each pillar a whole number from -2 to +2. A +2 means the data are clearly strong and improving, 0 means mixed or flat, and -2 means clearly weak and worsening.
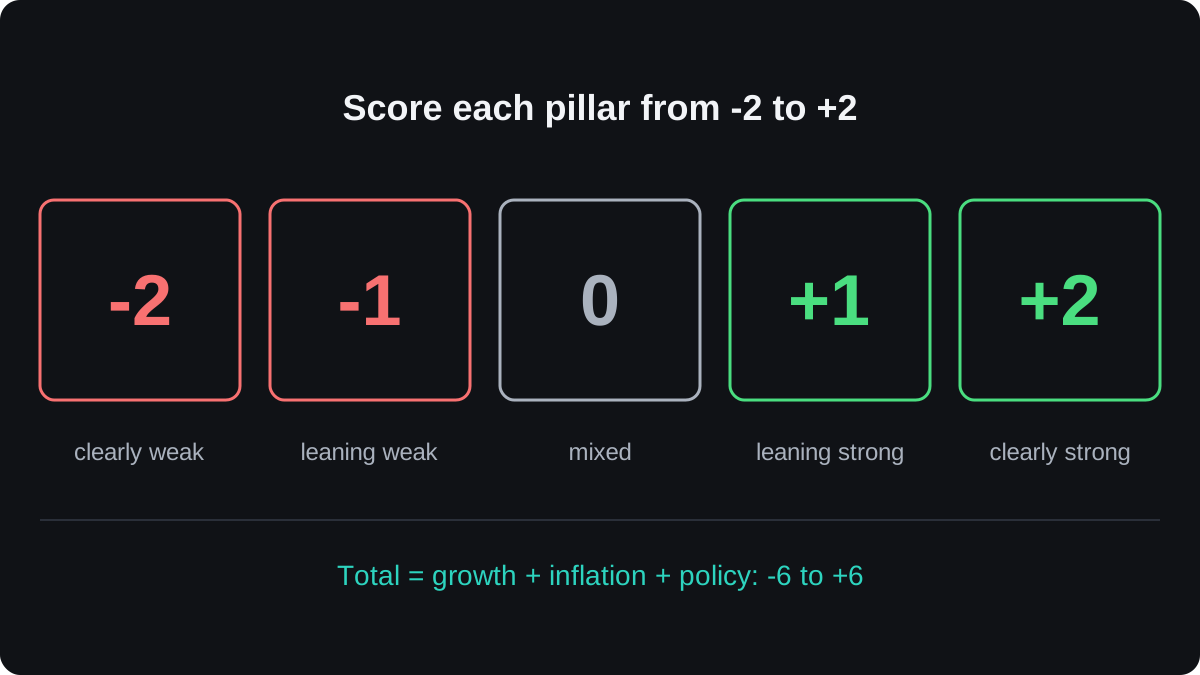
Add the three scores to get a total between -6 and +6. You could give policy double weight, because it moves rates most directly. Either choice is fine if you write it down and keep it the same.
For the readings, an economic calendar shows each release with its forecast and previous figure. Central bank statements and meeting minutes, published on each bank's own website, give the policy direction.
A worked example with two economies
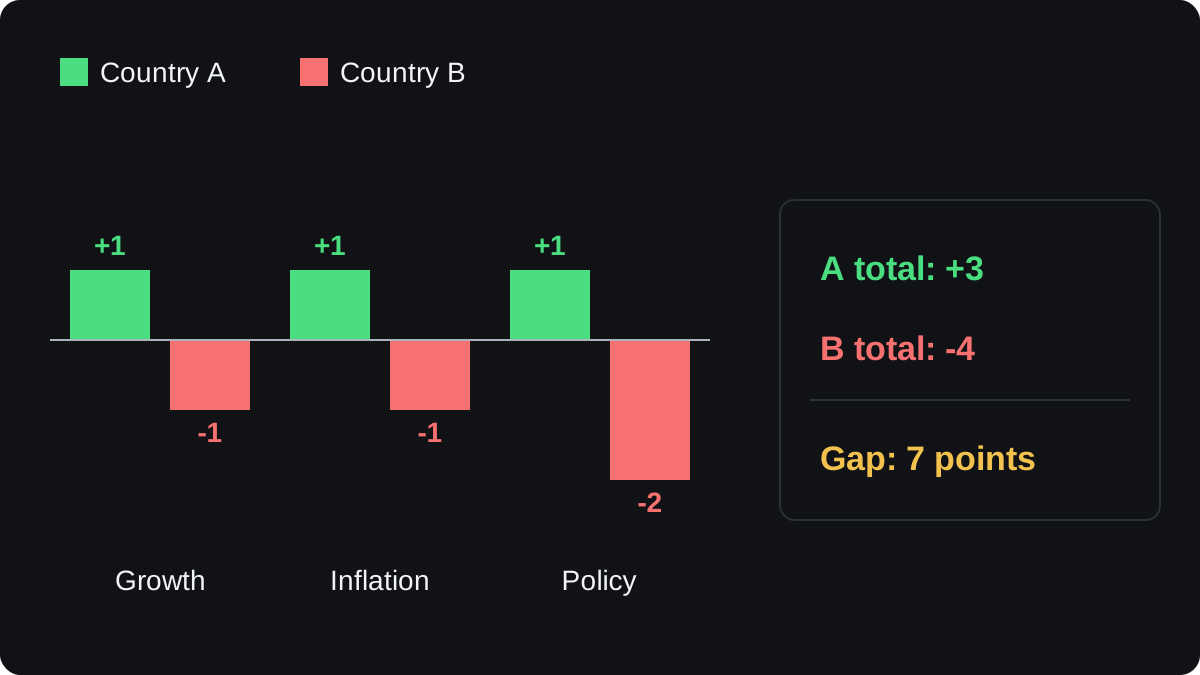
The two economies here are imaginary and every number is illustrative. Country A and Country B each have their own currency, and you score both on the same day.
| Pillar | Country A reading | A | Country B reading | B |
|---|---|---|---|---|
| Growth | GDP 2.0% to 2.5%, jobless 4.2% to 4.0% | +1 | GDP 1.0% to 0.5%, jobless 5.0% to 5.4% | -1 |
| Inflation | 3.2% to 3.5%, target 2% | +1 | 2.0% to 1.6%, target 2% | -1 |
| Policy | Held at 4.00%, rise left open | +1 | Cut from 3.00% to 2.75%, more cuts signalled | -2 |
| Total | +3 | -4 |
Step by step:
- Country A growth: GDP growth rose from 2.0% to 2.5% a year and unemployment fell from 4.2% to 4.0%. That is improving but modest, so +1.
- Country A inflation: 3.5%, up from 3.2%, against a 2% target. Above target and rising keeps the bank under pressure, so +1.
- Country A policy: the rate is held at 4.00% and the statement leaves another rise open. That leans tighter, so +1. The total is +3.
- Country B growth: GDP growth slowed from 1.0% to 0.5% and unemployment rose from 5.0% to 5.4%, so -1.
- Country B inflation: 1.6%, down from 2.0%, now below target, so -1.
- Country B policy: a cut from 3.00% to 2.75% with more cuts signalled is a clear direction, so -2. The total is -4.
- The gap is +3 minus -4, which is 7 points in favour of Country A's currency.
Country B's growth gets -1 rather than -2 because the economy is still growing, only more slowly. A score of -2 would fit a contraction or a sudden collapse in jobs.
The rates point the same way. 4.00% minus 2.75% is a gap of 1.25 percentage points in Country A's favour, and the guidance suggests that gap could widen.
Turning a score gap into a trade idea is the subject of the next lesson, pairing a strong currency with a weak one.
How do you keep the view up to date?
A view goes stale quickly. Rescore a pillar when its main data come out, and rescore policy after each central bank meeting or major speech.
Say Country A's next consumer price index (CPI), its main inflation figure, prints 2.8%. The forecast was 3.3% and the previous reading 3.5%.
Inflation is still above target, but it is falling fast and came in well below forecast. That weakens the case for another rate rise, so the inflation score drops from +1 to 0.
Country A's total falls from +3 to +2. Country B is unchanged at -4, so the gap narrows from 7 to 6.
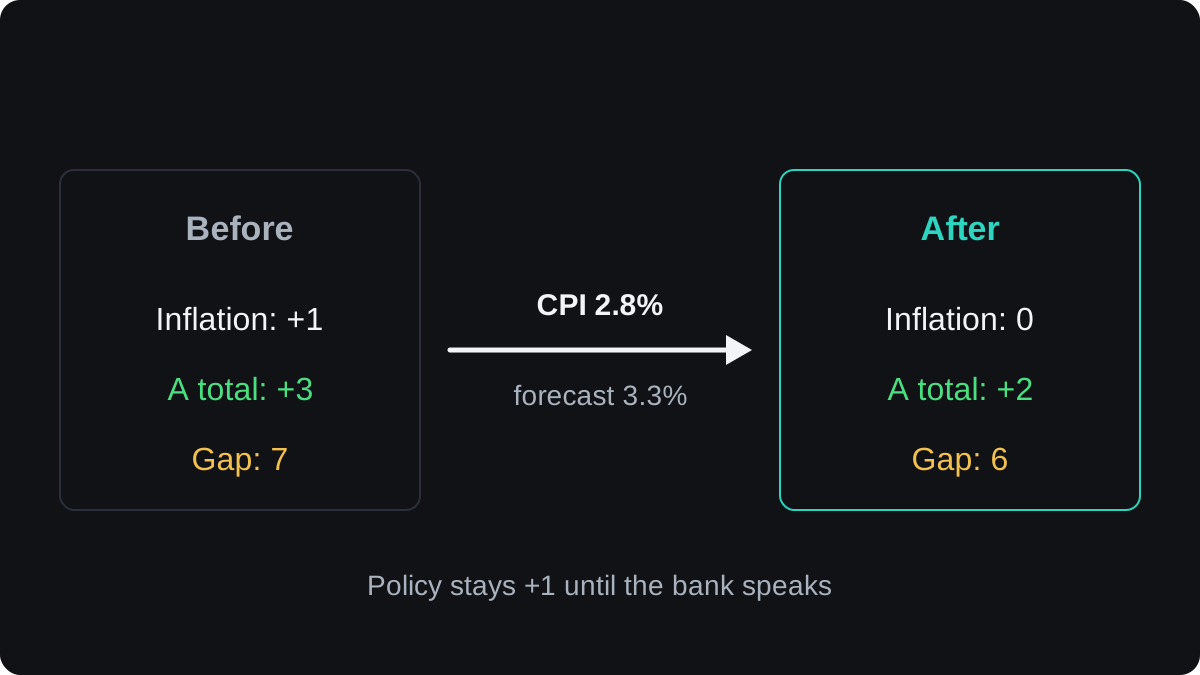
Leave the policy score at +1 until the central bank itself reacts. Scoring what you guess the bank will do mixes your own forecast into the data.
Date every version and keep the old ones. Looking back at how a view changed, and whether the price followed, is a fair test of your scoring rules.
Where does a fundamental view fail?
A clear score can sit beside a price moving the other way for weeks. These are the usual reasons:
- Much of the data may already be in the price. Everyone sees the same releases, so a score built on public news tells you what other traders also know.
- Risk sentiment can swamp the data. In a sharp sell-off across markets, money often moves into currencies seen as safe havens, whatever their scores. The risk-on and risk-off lesson covers this.
- Politics can override the data. A currency intervention, a surprise election result or new sanctions can move a currency far more than a growth report.
- Timing is weak. In a well-known 1983 study, economists Richard Meese and Kenneth Rogoff found that models based on economic data forecast exchange rates no better than a no-change guess over horizons up to a year.
- Scoring is personal. Two people can read the same data and score it differently, which is why written rules matter.
Treat the score as a background bias for weeks or months. Chart work can help with timing, and a later lesson in this module combines the two approaches.
Pertanyaan
What is a fundamental view of a currency?
It is a written, dated judgement of whether an economy's data favour its currency. This lesson builds it by scoring growth, inflation and central bank policy from -2 to +2 each.
Which economic data matter most for a currency?
Data that change expectations for interest rates usually matter most: inflation, jobs and growth figures, and central bank decisions. A surprise against the forecast tends to move prices more than the figure itself.
Does high inflation make a currency stronger or weaker?
It depends on the central bank. Inflation that pushes the bank to keep rates high can support a currency in the short run, while high inflation the bank ignores tends to weaken it.
How often should you update a fundamental view?
Rescore a pillar after its main release and rescore policy after each central bank meeting. Date each version so you can see how the view changed.
Can a fundamental score tell you when to enter a trade?
No. It shows which way the data lean, and prices can move against it for long periods, so timing needs a separate method.
Lanjut belajar
 Bab 4Pairing a strong currency with a weak one.A currency pair moves on the gap between its two currencies, so a correct view on one currency can still give a flat trade. Pairing a currency you expect to strengthen with one you expect to weaken lets both forces push the price the same way, though each half of that view is a forecast that can fail.
 Bab 4Combining fundamentals with technical analysis.Combining the two means using fundamental analysis to decide which direction you favour for a currency pair, then using the chart to choose when to enter, where to place the stop and where to take profit. You act only on chart signals that agree with that direction, which cuts trades but does not guarantee better results.

