Fibonacci cheat sheet.
Fibonacci retracement levels are 23.6%, 38.2%, 50%, 61.8% and 78.6% of the last swing, drawn from swing low to swing high in an uptrend. Extensions such as 127.2% and 161.8% project targets. A single level is weak evidence, so look for confluence, and stops usually sit beyond the level or the swing.
Konten ini baru tersedia dalam bahasa Inggris.
Every price on this page comes from one illustrative EUR/USD swing, from 1.08000 up to 1.10000, so you can redo each sum.
Which Fibonacci levels do traders use?
The ratios come from the Fibonacci sequence, where each number is the sum of the two before it: 1, 1, 2, 3, 5, 8, 13, 21, 34, 55, 89, 144.
One number divided by the next gives about 0.618 (34 ÷ 55). Divided by the number two places on, it gives about 0.382 (34 ÷ 89), and three places on, about 0.236 (34 ÷ 144).
| Level | Type | Origin |
|---|---|---|
| 23.6% | Retracement | 0.618 cubed |
| 38.2% | Retracement | 0.618 × 0.618 |
| 50% | Retracement | Halfway, by custom |
| 61.8% | Retracement | 1 ÷ 1.618 |
| 78.6% | Retracement | Square root of 0.618 |
| 127.2% | Extension | Square root of 1.618 |
| 161.8% | Extension | 1.618 |
| 261.8% | Extension | 1.618 × 1.618 |
A retracement level measures how deep a pullback goes into the last swing. An extension level projects how far the next swing might run past it.
How do you anchor the tool correctly?
A swing low is a bar with a lower low than the bars on either side, and a swing high is the mirror image.
- Draw from swing low to swing high in an uptrend, and from swing high to swing low in a downtrend.
- Anchor on wicks or on closes, the same way on every chart.
- Check that 61.8% sits nearer the start of the move than 38.2%, since platforms differ on which end is 0%.
- Redraw after a new swing beyond the old high or low.
- Never slide the anchors to fit a past turn.
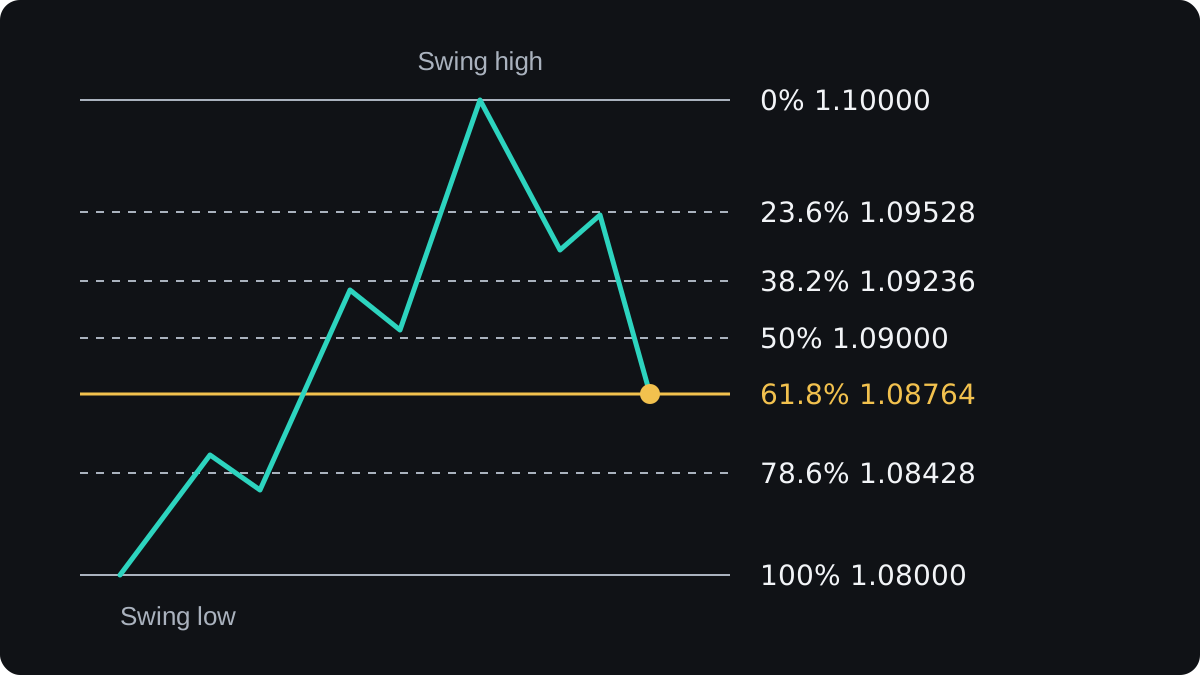
The drawing lesson shows each step. In an uptrend, each level is the high minus the range times the ratio.
The range is 1.10000 minus 1.08000, or 200 pips. So 61.8% sits 200 × 0.618 = 123.6 pips below the high, at 1.08764.
The same sum puts 23.6% at 1.09528, 38.2% at 1.09236, 50% at 1.09000 and 78.6% at 1.08428. In a downtrend, add to the low instead; the Fibonacci calculator does both.
Why does a level need company?
Between 23.6% and 78.6%, the widest gap is 61.8% to 78.6%, at 33.6 pips. Any pullback ending in that span is within 16.8 pips of a level.
Turns near a line happen often by chance, and evidence that markets respect the exact ratios is weak.
Confluence is two or more separate tools pointing at the same price. It gives a level more reason to matter, though a reversal is never certain.
| Combine with | Look for | Weak point |
|---|---|---|
| Support and resistance | An old turn near the level | Wide zones fit almost any level |
| Trend line | The line crossing the level | A line drawn later touches anything |
| Candlestick pattern | A reversal candle closing at the level | One candle can fail on the next bar |
An old resistance at 1.08750, broken on the way up, sits 1.4 pips below 61.8%, which is why the plan below uses that level.
How do extensions set profit targets?
Extensions use three points: A, the swing low at 1.08000; B, the swing high at 1.10000; and C, the end of the pullback at 1.08764. Each target is C plus the 200 pip AB distance times the ratio.
| Extension | Sum | Target |
|---|---|---|
| 100% | 1.08764 + 0.02000 | 1.10764 |
| 127.2% | 1.08764 + 0.02544 | 1.11308 |
| 161.8% | 1.08764 + 0.03236 | 1.12000 |
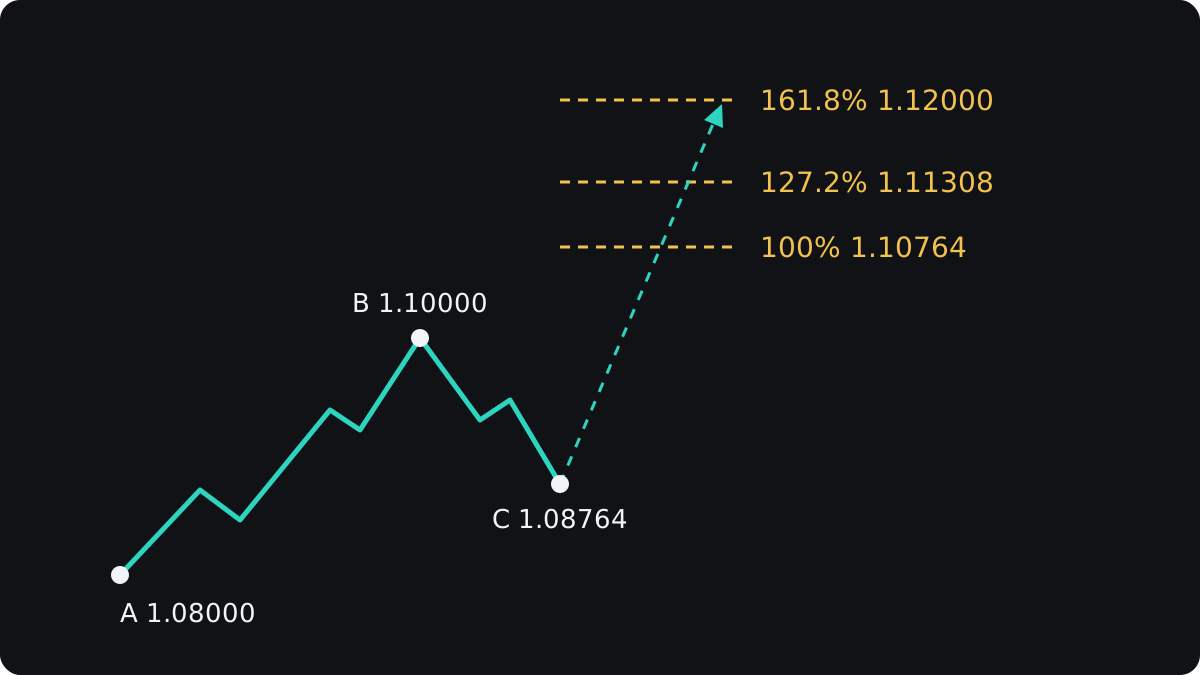
Price must pass B before any target, so some plans take partial profit there, and it can stop short of all of them. The extensions lesson compares the targets.
Where do the stop and the size go?
A stop right on a line is easily hit by a brief poke through it, so stops usually sit beyond the level with a buffer, or beyond the swing.
Say you buy at 1.08764 and risk $100. On EUR/USD in a USD account, one pip on one standard lot is $10.
- Stop A at 1.08400, just below the 78.6% level, is 36.4 pips away. $100 ÷ (36.4 × $10) = 0.2747, rounded down to 0.27 lot, a real risk of $98.28.
- Stop B at 1.07950, 5 pips below the swing low, is 81.4 pips away. $100 ÷ (81.4 × $10) = 0.1229, rounded down to 0.12 lot, a real risk of $97.68.
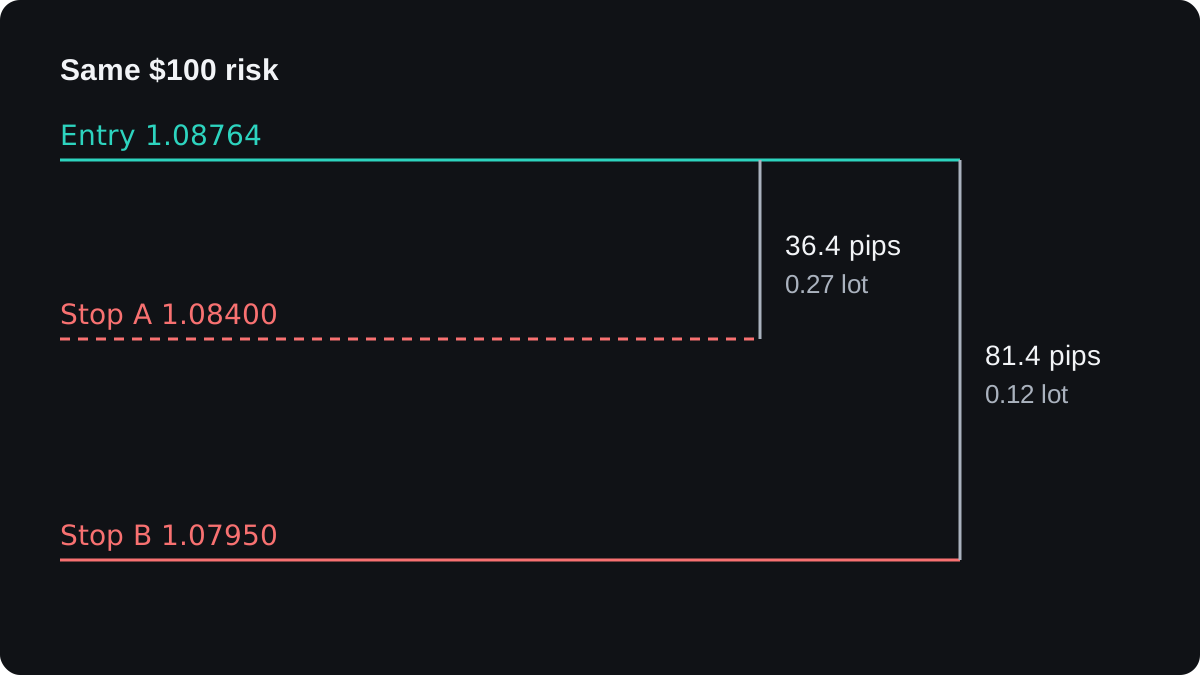
To the old high the reward is 123.6 pips, about 3.4 times the risk with stop A and 1.5 times with stop B. The tighter stop sits nearer normal noise, so it is more likely to be hit.
The stop placement lesson covers this trade-off, and the lot size calculator repeats the sizing for any pair.
What should you check before using a level?
Before acting on any level, confirm that:
- The swing is finished and clear on your timeframe.
- Another tool points at the same price.
- Your plan says whether you wait for a candle close or act on the first touch.
- The stop sits beyond the level or the swing, and the size follows from it.
- A close beyond the 100% level cancels the setup.
Pertanyaan
Which Fibonacci level is the most important?
No good evidence shows one level holding more often than the others. Rank them by how much other evidence sits around them.
Do Fibonacci retracements work in forex?
They measure pullbacks consistently, but evidence for the exact ratios is weak. Test any rule on past data and a demo account first.
Should I draw Fibonacci on wicks or candle bodies?
Either, if you choose the same way every time. Wicks capture the full high and low, while bodies ignore brief spikes.
What is the difference between a retracement and an extension?
A retracement measures a pullback inside the last swing. An extension projects past it, at levels such as 127.2% and 161.8%, for targets.
Lanjut belajar
 Bab 3What are Fibonacci retracement levels?Fibonacci retracement levels are lines drawn at fixed percentages of a price move to mark how deep a pullback has gone. The usual levels are 23.6%, 38.2%, 50%, 61.8% and 78.6%. The middle three get the most attention, but the evidence that price turns at them more than anywhere else is weak.
 Bab 3How to draw Fibonacci retracements.In an uptrend, draw a Fibonacci retracement from the swing low to the swing high, so the levels sit below the high. In a downtrend, draw from the swing high to the swing low, so the levels sit above the low. Use the clear extremes of one completed move, wick to wick.
 Bab 3Combining Fibonacci with support and resistance.Combining Fibonacci with support and resistance means checking whether a retracement level sits on a price the market has reacted to before, such as an old high. When the two line up within a few pips, traders call it a confluence zone and watch it more closely. Price can still break straight through a zone.
 Bab 3Combining Fibonacci with trend lines.A Fibonacci retracement offers several levels where a pullback might stop. A trend line through earlier swing lows, or swing highs in a downtrend, narrows the choice: watch the level the line crosses around the time price returns to it. That meeting point is a zone of interest, and price can still break through it.
 Bab 3Combining Fibonacci with candlestick patterns.Combining Fibonacci with candlesticks means waiting for a reversal candle, such as a hammer or an engulfing pattern, to close at a retracement level before you enter. The level shows where a pullback might stop, and the candle shows buyers or sellers stepping in. The cost is a later entry, and the signal still fails often.
 Bab 3Fibonacci extensions for profit targets.A Fibonacci extension projects how far a trend might run after a pullback. You measure the first swing, multiply it by ratios such as 61.8%, 100% and 161.8%, and add each result to the low of the pullback. Traders use the levels as possible take-profit targets, with no guarantee that price reaches them.
 Bab 3Placing stops with Fibonacci levels.A Fibonacci stop goes beyond the next retracement level past your entry, plus a small buffer for the spread and noise. Buy at 50% and the stop sits under 61.8%; sell at 50% and it sits above 61.8%. Then cut the lot size so the wider stop still risks only the money you planned.

