What are Fibonacci retracement levels?
Fibonacci retracement levels are lines drawn at fixed percentages of a price move to mark how deep a pullback has gone. The usual levels are 23.6%, 38.2%, 50%, 61.8% and 78.6%. The middle three get the most attention, but the evidence that price turns at them more than anywhere else is weak.
Konten ini baru tersedia dalam bahasa Inggris.

Prices rarely travel in a straight line. EUR/USD might climb 200 pips over a week, give back 90 of them, then start rising again. That giveback is called a pullback, or a retracement.
Fibonacci retracement levels are lines drawn at fixed percentages of a move, marking how deep a pullback has gone. The usual set is 23.6%, 38.2%, 50%, 61.8% and 78.6%.
What does a Fibonacci retracement measure?
Start with a finished move from a low to a high. A retracement is the part of that move that price gives back, written as a percentage of the whole move.
Say EUR/USD rises from 1.08000 to 1.10000. That is a move of 0.02000, or 200 pips. If price then falls back to 1.09000, it has given back 100 pips, a 50% retracement.
A Fibonacci retracement is a charting tool that draws horizontal lines at set percentages between two points. You choose the start and end of the move, and the tool works out the prices.
Those two points are swing highs and swing lows, the clear turning points on the chart. Picking them well is most of the skill, and the next lesson covers it.
Where do the ratios come from?
The Fibonacci sequence runs 1, 1, 2, 3, 5, 8, 13, 21, 34, 55, 89 and on without end. Each number is the sum of the two before it.
It is named after Leonardo of Pisa, a 13th century Italian mathematician later known as Fibonacci. He wrote about it centuries before anyone drew it on a price chart.
Past the first few terms, dividing a number by the next one gives about 0.618. For example, 55 ÷ 89 = 0.618.
Divide by the number two places later and you get about 0.382, so 34 ÷ 89 = 0.382. Three places later gives about 0.236, so 21 ÷ 89 = 0.236.
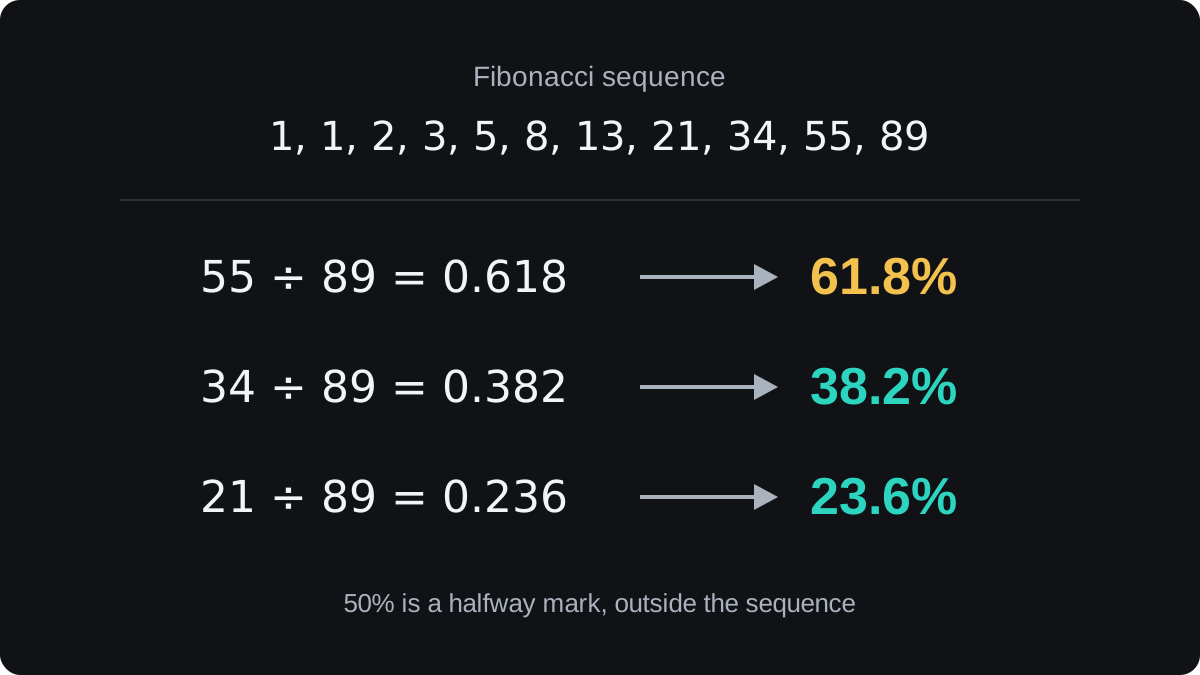
The 0.618 figure is linked to the golden ratio, about 1.618, because 1 ÷ 1.618 = 0.618. Traders turn these decimals into the 61.8%, 38.2% and 23.6% lines.
The other two lines have different origins. 50% is a plain halfway mark that does not appear in the sequence. Traders add it because halfway is an easy reference point.
78.6% is the square root of 0.618. Some platforms show 76.4% instead, which is 100% minus 23.6%, and some leave the deep level out. Most tools let you edit the list.
The maths explains where the numbers come from. It gives no reason why a currency should turn at any of them.
How do you calculate the levels?
In an uptrend the levels are measured down from the high, because the pullback falls from there:
Level = high − (high − low) × ratio
Using the EUR/USD move, with round illustrative prices:
- The low is 1.08000 and the high is 1.10000, so the move is 0.02000, or 200 pips.
- For 38.2%: 0.02000 × 0.382 = 0.00764, and 1.10000 − 0.00764 = 1.09236.
- For 50%: 0.02000 × 0.5 = 0.01000, and 1.10000 − 0.01000 = 1.09000.
- For 61.8%: 0.02000 × 0.618 = 0.01236, and 1.10000 − 0.01236 = 1.08764.
The full set for this move looks like this:
| Level | Distance from the high | Price |
|---|---|---|
| 0% | 0 pips | 1.10000 |
| 23.6% | 47.2 pips | 1.09528 |
| 38.2% | 76.4 pips | 1.09236 |
| 50% | 100.0 pips | 1.09000 |
| 61.8% | 123.6 pips | 1.08764 |
| 78.6% | 157.2 pips | 1.08428 |
| 100% | 200.0 pips | 1.08000 |
The 0% line is the high, where the pullback starts. The 100% line is the low, and a fall below it has erased the whole move.
In the chart below, the pullback stops at the 61.8% line, 1.08764, before price turns up again.
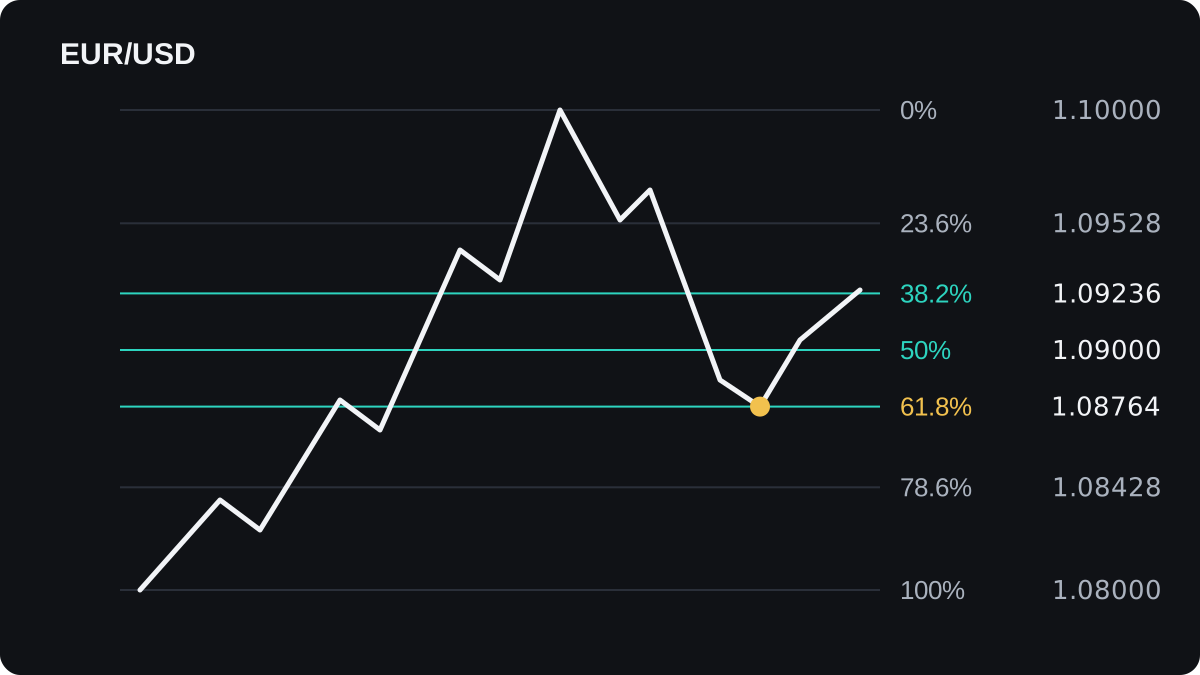
The Fibonacci calculator repeats this sum for any pair of prices. On a chart, the drawing tool does it as you drag from one swing point to the other.
Why do 38.2%, 50% and 61.8% get the most attention?
These three sit in the middle of the move. In the EUR/USD example they span 1.09236 down to 1.08764, a band 47.2 pips wide, between 76.4 and 123.6 pips below the high.
A pullback of 23.6% is shallow. On the 200 pip move it is 47.2 pips, small enough to come from ordinary back and forth inside a strong trend.
A pullback of 78.6% is deep. Price has given back most of the move, so the trend itself is open to question.
That leaves the middle band as the zone where a trend is commonly seen as pausing without breaking. The 61.8% line also carries the golden ratio story, and 50% is easy to spot even without a tool.
There is a crowd argument too. If many people watch the same lines, their orders may cluster there and make price react. The idea is plausible, but it is hard to prove from charts alone.
A common reading is that a pullback stopping near 38.2% hints at a strong trend, while one that needs 61.8% hints at a weaker one. Treat that as a rule of thumb with plenty of exceptions.
How does it work in a downtrend?
In a downtrend the tool runs the other way. The pullback rises from the low, so the levels are measured up from the low:
Level = low + (high − low) × ratio
Say USD/JPY falls from 152.000 to 148.000. On a yen pair a pip is 0.01, so the move of 4.000 is 400 pips.
- For 38.2%: 4.000 × 0.382 = 1.528, and 148.000 + 1.528 = 149.528.
- For 50%: 4.000 × 0.5 = 2.000, and 148.000 + 2.000 = 150.000.
- For 61.8%: 4.000 × 0.618 = 2.472, and 148.000 + 2.472 = 150.472.
In pips, those lines sit 152.8, 200.0 and 247.2 pips above the low.
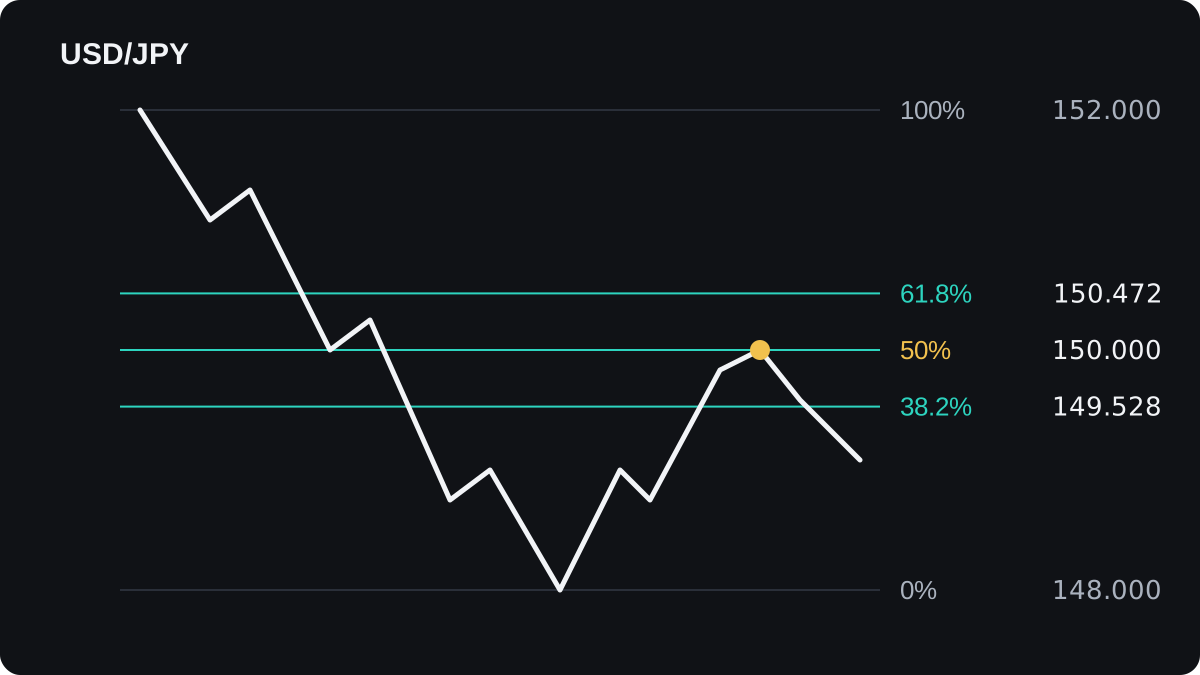
Suppose price bounces to 150.000 and stalls. A trader who sells there is betting that the fall resumes. The line marks where the bet is placed and says nothing about its odds.
If price instead climbs back above 152.000, the swing high, the downtrend the tool was drawn on has ended. Where a stop could go around these lines is covered in placing stops with Fibonacci levels.
How reliable are Fibonacci levels?
They are less reliable than the neat lines suggest. With five levels spread across a move, a pullback is bound to end near one of them fairly often.
Look at the gaps. Between 23.6% and 78.6%, the widest gap is 16.8 percentage points, from 61.8% to 78.6%. So no pullback in that range ends more than 8.4 percentage points from a line.
On the 200 pip EUR/USD move, 8.4 percentage points is 16.8 pips. Allow a few pips of tolerance around each line and almost any pullback can be made to fit.
Hindsight adds to the problem. On an old chart you notice the line that held and skip past the ones price cut straight through.
Different traders also pick different swing points, and that moves every level. There is little solid evidence that these exact ratios predict turning points better than other fractions of a move.
The levels are more useful as a map of where to look. Later lessons in this module add confirmation, such as a nearby support or resistance level or a candle pattern at the line.
The tool also needs a clear move to measure. In a ranging market there is often no clean swing high and swing low, so the lines mean even less.
Pertanyaan
What are the main Fibonacci retracement levels?
The usual set is 23.6%, 38.2%, 50%, 61.8% and 78.6%. Most attention goes to 38.2%, 50% and 61.8%, which sit in the middle of the move.
Is 50% a Fibonacci ratio?
No. It does not come from the Fibonacci sequence. Charting tools include it because halfway is a natural place to check how much of a move has been given back.
Which Fibonacci level is the strongest?
No level reliably holds better than the others. 61.8% gets the most attention because of its link to the golden ratio, and price can still cut through it.
Do Fibonacci retracements work in forex?
They measure pullback depth exactly, since that is plain arithmetic. Evidence that they predict where price will turn is weak, so use them to choose where to watch and look for other evidence before acting.
What is the difference between a retracement and an extension?
A retracement measures a pullback inside the move, between 0% and 100%. An extension projects beyond the end of the move and is often used for profit targets, as the lesson on Fibonacci extensions explains.
Lanjut belajar
 Bab 3How to draw Fibonacci retracements.In an uptrend, draw a Fibonacci retracement from the swing low to the swing high, so the levels sit below the high. In a downtrend, draw from the swing high to the swing low, so the levels sit above the low. Use the clear extremes of one completed move, wick to wick.
 Bab 3Combining Fibonacci with support and resistance.Combining Fibonacci with support and resistance means checking whether a retracement level sits on a price the market has reacted to before, such as an old high. When the two line up within a few pips, traders call it a confluence zone and watch it more closely. Price can still break straight through a zone.
 Bab 3Combining Fibonacci with trend lines.A Fibonacci retracement offers several levels where a pullback might stop. A trend line through earlier swing lows, or swing highs in a downtrend, narrows the choice: watch the level the line crosses around the time price returns to it. That meeting point is a zone of interest, and price can still break through it.
 Bab 3Combining Fibonacci with candlestick patterns.Combining Fibonacci with candlesticks means waiting for a reversal candle, such as a hammer or an engulfing pattern, to close at a retracement level before you enter. The level shows where a pullback might stop, and the candle shows buyers or sellers stepping in. The cost is a later entry, and the signal still fails often.
 Bab 3Fibonacci extensions for profit targets.A Fibonacci extension projects how far a trend might run after a pullback. You measure the first swing, multiply it by ratios such as 61.8%, 100% and 161.8%, and add each result to the low of the pullback. Traders use the levels as possible take-profit targets, with no guarantee that price reaches them.
 Bab 3Placing stops with Fibonacci levels.A Fibonacci stop goes beyond the next retracement level past your entry, plus a small buffer for the spread and noise. Buy at 50% and the stop sits under 61.8%; sell at 50% and it sits above 61.8%. Then cut the lot size so the wider stop still risks only the money you planned.
 Bab 3Fibonacci cheat sheet.Fibonacci retracement levels are 23.6%, 38.2%, 50%, 61.8% and 78.6% of the last swing, drawn from swing low to swing high in an uptrend. Extensions such as 127.2% and 161.8% project targets. A single level is weak evidence, so look for confluence, and stops usually sit beyond the level or the swing.

