Matching your strategy to the market.
Match the setup to the market's behaviour. In a trend, setups that buy pullbacks or breakouts and trail the stop suit the move. In a range, buying near support and selling near resistance with a fixed target suits it. When signals conflict, news is due or costs are large next to the target, standing aside or cutting size is the safer choice.
Konten ini baru tersedia dalam bahasa Inggris.

A buy at support can be a sound trade on Monday and a poor one on Thursday. The chart pattern looks the same. What changed is the market around it: a quiet range on Monday, a strong downtrend by Thursday.
So the choice of setup starts with reading the market type. Sometimes that reading says to place no trade at all.
Why does the same setup win in one market and lose in another?
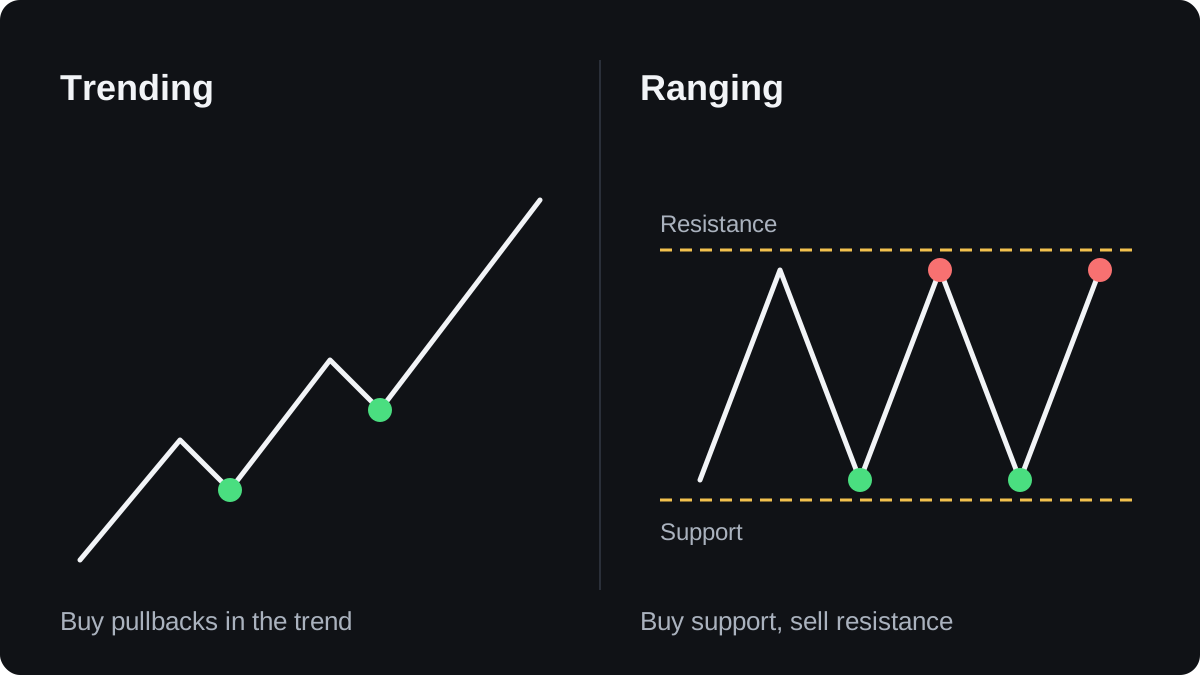
Every setup carries a hidden bet about what price does next. A trend setup bets that a move will continue. A range setup bets that a move will reverse at an edge.
Those bets are opposites. When the market matches the bet, the setup has a reason to exist. When it does not, the same entry rules keep putting you on the wrong side.
The trending versus ranging lesson showed how to tell the two apart, and measuring volatility showed how to size the typical move. You need both readings to pick a setup and its stop.
Which setups fit a trending market?
In an uptrend, price makes higher highs and higher lows. The usual approach is to buy after a pullback, a short move against the trend, expecting the next leg higher to follow.
Common trend entries and exits include:
- Buying a pullback to a rising moving average, or to an old resistance level that now holds as support.
- Buying a breakout above the last swing high, expecting the move to continue.
- Holding the trade with a trailing stop, a stop that moves up as price rises, so the trend itself decides the exit.
A downtrend uses the mirror image: you sell rallies and sell breaks below the last swing low.
Trend setups fail at the turn. When a trend fades into a range, pullback buys keep getting stopped out for small losses. That run of small losses is called whipsaw, and it is the usual way this style loses money.
Which setups fit a ranging market?
In a range, price swings between a floor and a ceiling without making progress. Range setups buy near support, sell near resistance, and take profit before the opposite edge.
Oscillators such as the RSI are often used here, because their extreme readings often appear near the edges of a range. In a strong trend, the same oscillator can stay at an extreme for a long time while price keeps going.
Here is a range trade on EUR/USD with round illustrative prices. The pair has swung between 1.08000 and 1.08600 for several days, a range of 60 pips.
- You buy 0.20 lot at 1.08050, just above support.
- Your stop goes at 1.07900, below the floor. Risk: 1.08050 minus 1.07900 = 0.00150, which is 15 pips.
- Your target is 1.08500, short of the ceiling. Reward: 1.08500 minus 1.08050 = 0.00450, which is 45 pips.
- In a USD account, a pip on 0.20 lot is worth $2, so you risk 15 × $2 = $30 to make 45 × $2 = $90.
These sums cover price only, so the spread and any commission come on top.
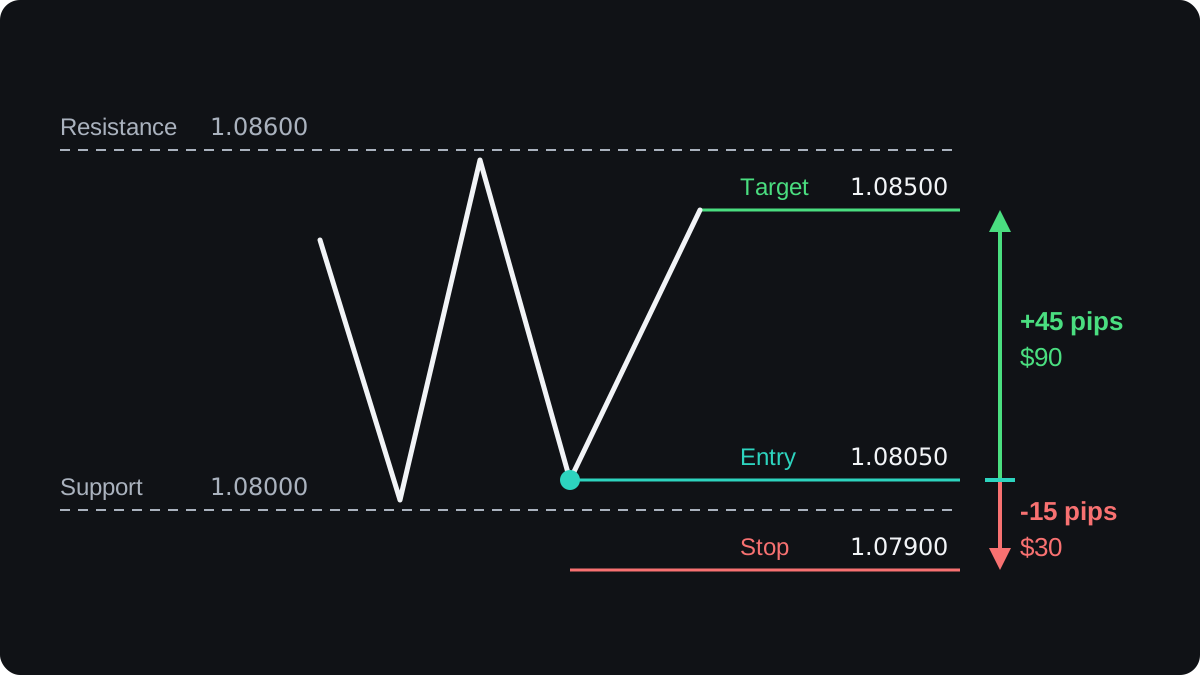
The target sits below resistance on purpose. Price can turn before it reaches the exact edge, so asking for the full 60 pips makes the trade harder to finish.
Range setups fail at the break. If support gives way, the stop takes you out, and the larger danger is moving the stop lower in the hope that the range returns.
A false breakout sometimes does return, but you cannot tell which kind it is while it happens.
How do stops and position size change between the two?
A range gives you a clear line where the idea is wrong, so the stop can sit close. Trend pullbacks are noisier, so the stop usually needs more room.
One way to set it is with the average true range (ATR), the average size of one bar's move over a set number of bars.
A worked example, with illustrative numbers:
- Your account is $5,000 and you risk 1% per trade, which is $50.
- EUR/USD's ATR on the 1 hour chart is 20 pips. You set the trend stop at 1.5 × ATR, so 1.5 × 20 = 30 pips.
- In a USD account, one standard lot of EUR/USD is worth $10 per pip. Size = $50 ÷ (30 × $10) = 0.1667 lot.
- Round down to 0.16 lot. Actual risk: 30 × $1.60 = $48.
The range trade above risked $30 on 0.20 lot. Sized to the same $50, its 15 pip stop allows $50 ÷ (15 × $10) = 0.333 lot, rounded down to 0.33 lot. That is a risk of 15 × $3.30 = $49.50.
| Range trade | Trend trade | |
|---|---|---|
| Stop | 15 pips, below support | 30 pips, 1.5 × ATR |
| Size for $50 risk | 0.33 lot | 0.16 lot |
| Dollar risk | $49.50 | $48.00 |
| Exit | Fixed target near the far edge | Trailing stop |
The wider stop means a smaller position, so the dollar risk stays about the same. The 1.5 multiple is an example, not a standard. The position size lesson covers the formula in full.
The two styles also tend to produce different results. Trend following usually wins less often with larger winners. Range trading usually wins more often with smaller winners and an occasional larger loss at a break. Any one strategy can differ, so check yours in testing.
When should you stand aside?
Put together, the choice has three outcomes. A clear trend calls for trend setups, a clear range calls for range setups, and anything else calls for no trade or a smaller one.
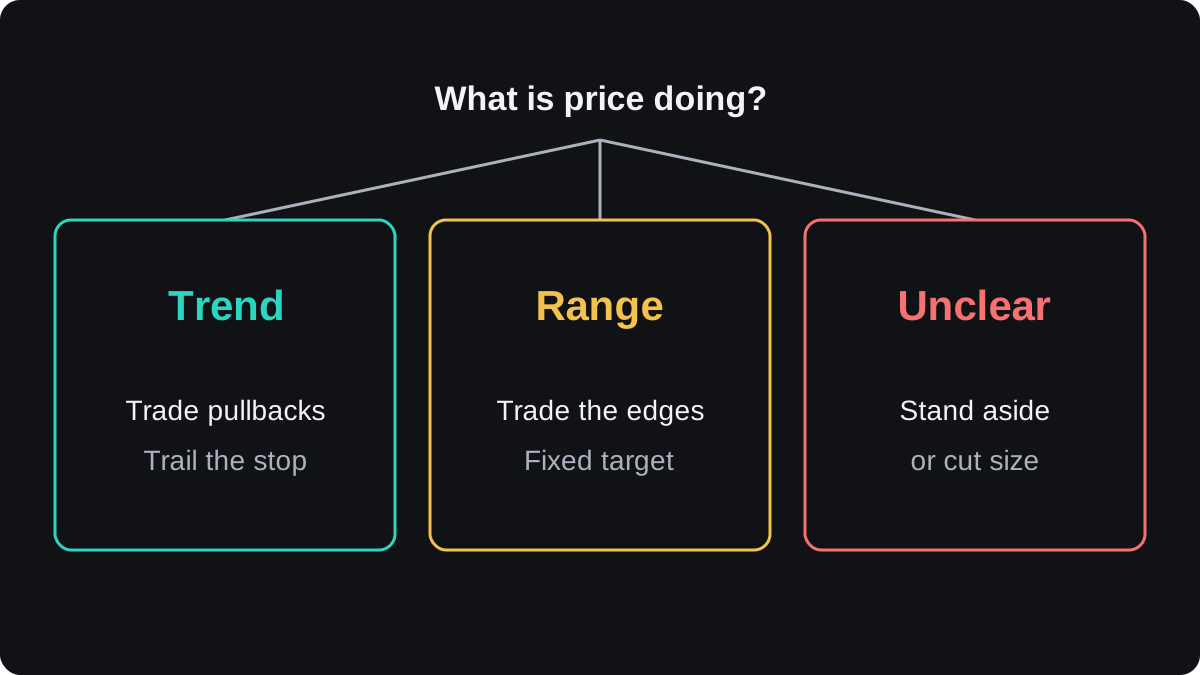
To stand aside means to place no new trade until the market gives a clearer reading. A trade you skip has no spread and no commission. Common reasons to wait:
- The signals disagree. The daily chart trends down while the hourly chart drifts sideways, and you cannot say which one your setup depends on.
- A major release is due. Spreads can widen and price can jump past stops around it, and the economic calendar lists the times.
- Volatility is far from normal. If ATR is twice its usual reading, a stop of your usual pip size sits inside the noise, and an ATR-based stop gets so wide that your size must shrink sharply.
- The move is too small for the cost. With a 1 pip spread and an 8 pip target, the spread alone is 1 ÷ 8 = 12.5% of the target.
- Liquidity is thin, for example around the daily rollover, when spreads on many pairs widen.
Cutting size is a middle path. Trading half your usual size in a mixed market halves the damage if your reading is wrong, and it halves the gain if you are right.
Where does this approach fall short?
Labels like trend and range are clearest in hindsight. At the live right edge of a chart, the first bars of a new range look the same as a pullback in a trend.
Trend strength tools lag price. The ADX is often read as trending above about 25 and weak below about 20, but those levels are conventions, and the ADX rises only after a move has started.
Switching styles also adds a decision that can itself be wrong. Public, checkable evidence that switching between trend and range methods improves results is limited, so treat the idea as something to test.
One plain test: write the market type in your trading journal before each trade. After 50 or more demo trades, compare results by type to see whether your reading adds anything.
Pertanyaan
What is the best strategy for a ranging market?
No strategy is best in every range. A common approach buys near support and sells near resistance with a stop just outside the range, and it loses when the range breaks.
How do I know if the market is trending or ranging?
A trend shows higher highs and higher lows (or lower ones) and a sloping moving average. A range shows repeated touches of flat edges. All of these readings lag, so they can be wrong at turning points.
Should I trade during news releases?
That depends on your plan. Spreads can widen and stops can fill at worse prices around major releases, so if your plan has no rule for news, waiting until the release has passed is the simpler choice.
Can one strategy work in all market conditions?
No setup suits every market. Some strategies add filters that switch them off in conditions they do not suit, so test any strategy across both trends and ranges before trusting it.
Lanjut belajar
 Bab 3Trending versus ranging markets.A trending market makes a run of swings in one direction: higher highs and higher lows in an uptrend, lower highs and lower lows in a downtrend. A ranging market turns back and forth between a ceiling and a floor. Swing points, a moving average's slope and ADX help you tell them apart.
 Bab 3Measuring volatility.Volatility is how far price tends to move in a given period. The most common measure is average true range (ATR), the average of recent true ranges, where true range includes any gap from the previous close. ATR shows how far a pair usually moves, but it gives no direction and only describes the past.

