What is a breakout?
A breakout is a move that takes price out of a range or chart pattern, through a support or resistance level that had held it before. Traders usually wait for a candle to close beyond the level. A break tends to hold better when the move is strong and agrees with the larger trend, though neither condition guarantees it.
Konten ini baru tersedia dalam bahasa Inggris.

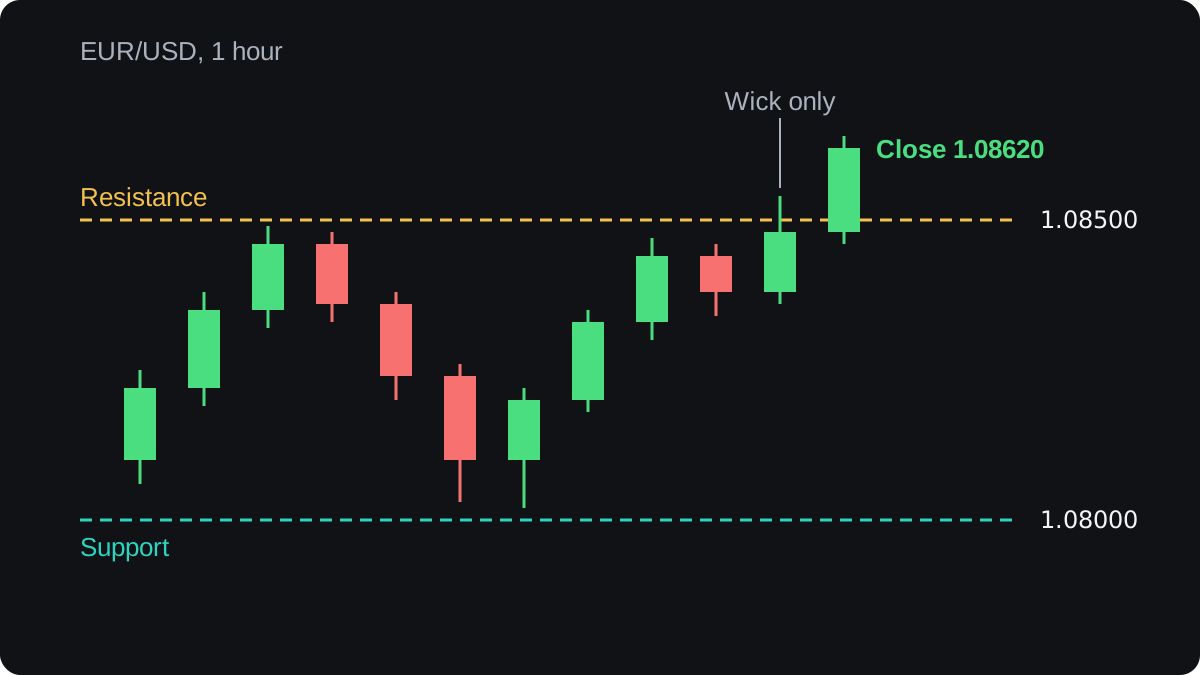
Picture EUR/USD trading between 1.08000 and 1.08500 for three days. Each rally fades near the top and each dip finds buyers near the bottom. Then an hourly candle closes at 1.08620, above the ceiling, and price keeps rising.
That move out of the box is a breakout: price leaving a range or pattern through a level that had stopped it before. The prices in this lesson are round illustrative numbers.
What does a breakout look like on a chart?
A range has a ceiling and a floor. The ceiling is resistance, where rallies have stalled, and the floor is support, where falls have stopped.
In the example, the range is 1.08500 − 1.08000 = 0.00500 tall. On EUR/USD a pip is 0.0001, so that is 50 pips.
A break above resistance is an upside breakout. A break below support is a downside breakout, also called a breakdown. Either one tells you the balance between buyers and sellers inside the range has changed, at least for now.
Which levels can price break out of?
Any level that has turned price more than once can be broken. The usual candidates are:
- A horizontal range, also called a rectangle, with flat support and resistance.
- A trend line, or the edge of a price channel.
- A chart pattern such as a triangle, where the highs and lows squeeze together.
- An obvious earlier high or low, such as the previous day's high.
Levels are rarely exact lines. Price often pokes a few pips past them and comes back, so it helps to treat each level as a zone. That habit shapes how you decide whether a break is real.
When does a break count?
A wick through a level and a close through it are different events. Back to the EUR/USD range on an hourly chart:
- A candle rises to 1.08540 but closes at 1.08480. The wick went 4 pips above resistance, and the close stayed 2 pips below it. The level was tested and held.
- The next candle closes at 1.08620. That is 1.08620 − 1.08500 = 0.00120 above resistance, or 12 pips.
- Say your rule needs a close at least 10 pips beyond the level. A 12 pip close passes, so you count it as a breakout.
A fixed buffer in pips is a blunt rule. Ten pips is a big move on a quiet pair and a small one on a volatile pair, so another approach sets the buffer as a fraction of the average candle range.
The timeframe of the close matters too. A 5-minute close above 1.08500 says much less than a daily close above it, because it covers only five minutes of trading.
What helps a breakout keep going?
No condition guarantees that a break will last. The signs below tend to come with breaks that have real buying or selling behind them, and each one has limits.
The size of the breakout candle
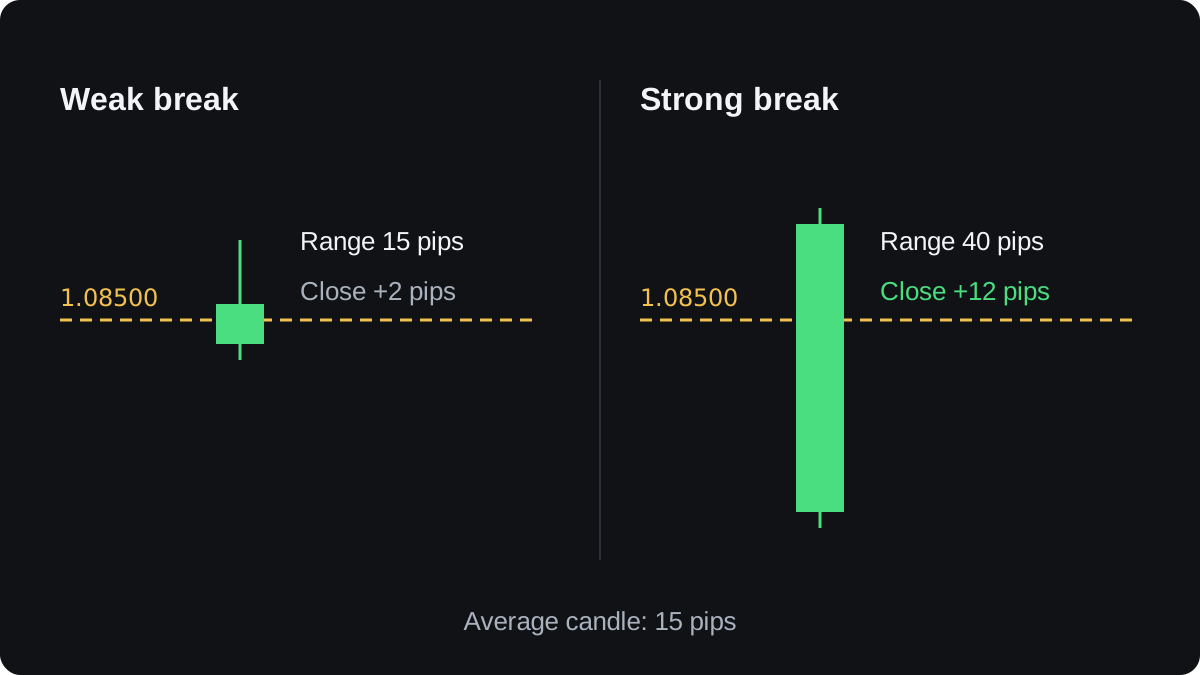
Suppose recent hourly candles on EUR/USD averaged 15 pips from high to low. A breakout candle that covers 40 pips and closes 12 pips above the level, near its high, shows buyers pushing hard through it.
A 15 pip candle that closes 2 pips above resistance with a long upper wick shows much less. Sellers pushed price back down before the hour ended.
Quiet trading before the break
A range that narrows before it breaks, with smaller candles and tighter swings, is often followed by a larger move, though not reliably. The quiet suggests a move may be building, but it says nothing about the direction.
The volatility lesson shows how to measure that squeeze with numbers instead of by eye.
The larger trend
A break in the same direction as the trend on a higher timeframe moves with the larger flow already under way. An upside break on the hourly chart inside a falling daily trend moves against it.
Trends do end, so a break against the larger trend is sometimes the first sign of a reversal. Agreement with the trend improves the odds without settling the question.
Market hours and news
Breaks during busy hours, such as the overlap of the London and New York sessions, meet more orders than breaks in thin hours. The trading sessions lesson shows when each market is open.
A break driven by a data release can be fast, and it can also reverse within minutes once the market has digested the number.
Volume, with a caveat
On stock and futures charts, rising volume on the break is a common check. Spot forex has no central exchange, so there is no single volume figure for a pair.
MetaTrader shows tick volume, the number of price updates in each candle. It comes from your broker's feed and is only a rough stand-in for real activity.
A retest that holds
After an upside break, price may come back to the old resistance. If it stops there and turns up, the level has switched roles and is now support.
If price falls back inside the range, the break has probably failed. Price does not always retest, so waiting for one can mean missing the move.
How far can a breakout travel?
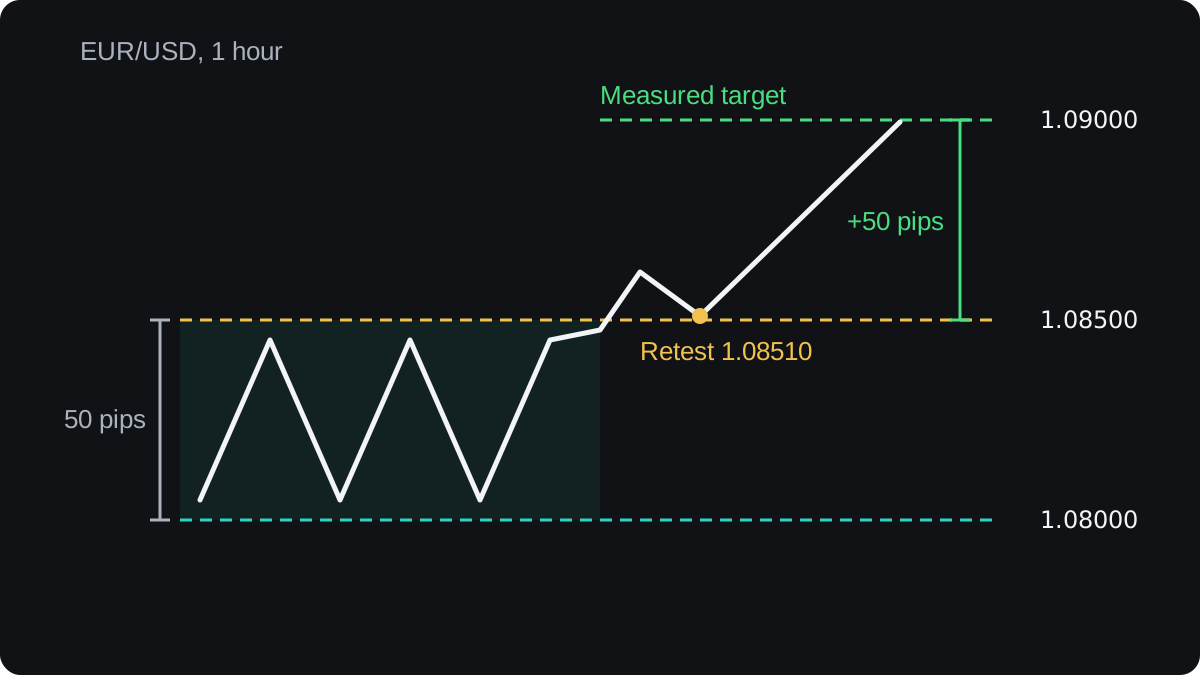
A common rough guide is the measured move: take the height of the range and project it from the level that broke. For the EUR/USD range:
- Range height: 1.08500 − 1.08000 = 0.00500, or 50 pips.
- Projection: 1.08500 + 0.00500 = 1.09000.
- Price retests at 1.08510 and turns up. The target stays at 1.09000, because it is measured from the broken level at 1.08500.
- On 0.10 lot, where one EUR/USD pip is worth $1, the 50 pips from 1.08500 to 1.09000 are worth $50.
A downside break uses the same steps. Say USD/JPY ranged between 150.00 and 151.20. On a JPY pair a pip is 0.01.
- Range height: 151.20 − 150.00 = 1.20, or 120 pips.
- A candle closes at 149.80, which is 150.00 − 149.80 = 0.20, or 20 pips below support.
- Projection: 150.00 − 1.20 = 148.80.
Treat the projection as a rough guide. Price can stall well short of it at another level or run far past it, and there is little solid evidence that measured moves predict targets reliably.
Why can a breakout fail?
A level that many people watch collects orders just beyond it. Above resistance sit the stop losses of traders who sold near the top, and the buy stop orders of traders waiting for the break.
When price reaches the level, those orders fill at once and can push it through. If no fresh buying follows, price drifts back into the range. That failed move is called a false breakout, or fakeout.
How often breaks fail depends on the pair, the timeframe and the rule used to define a break, so be wary of any single success rate.
The false breakouts lesson shows how they look, and how to trade breakouts covers entries and stops.
Pertanyaan
What is a breakout in forex?
A breakout is a move that takes price out of a range or pattern, through a support or resistance level that had held it before. An upside breakout goes through resistance and a downside breakout goes through support.
How do you confirm a breakout?
The usual rule waits for a candle to close beyond the level, often by a buffer such as a set number of pips. A strong candle and a retest that holds add weight, but neither confirms the move for certain.
What is the difference between a breakout and a fakeout?
A breakout moves beyond the level and keeps going. A fakeout crosses the level and then falls back inside the range, often within a few candles.
Which timeframe is best for breakouts?
No timeframe is best for everyone. A daily close beyond a level covers a full day of trading, while breaks on 5-minute charts appear far more often and carry more random noise.
Lanjut belajar
 Bab 2How to trade breakouts.You can trade a breakout in three ways. Enter on the break with a stop order, wait for a candle to close beyond the level, or wait for price to retest it. Earlier entries catch more moves and more false starts; later entries filter some failures but cost price or missed trades.
 Bab 2False breakouts and how to trade them.A false breakout is a move through support or resistance that fails and returns inside the old range, often leaving a long wick. A common way to trade one is to wait for a close back inside, sell or buy back toward the range, and set a stop just beyond the failed break's extreme. It loses when the break proves real.

