Drawdown and the maths of recovery.
A drawdown is the fall in your account from its highest point to a later low, shown as a percentage. Losses and gains are not symmetric: after losing 50% you need a 100% gain to break even, because the gain is earned on a smaller balance. The gain needed is the loss divided by one minus the loss.
ខ្លឹមសារនេះមានតែជាភាសាអង់គ្លេសសិន។

You open an account with $10,000, and a bad month takes it to $5,000. That is a 50% loss. To get back to $10,000 you now need to make $5,000 on a $5,000 balance, which is a 100% gain.
This gap between a loss and the gain needed to undo it is why risk management puts limiting losses ahead of chasing profit.
What is a drawdown?
Say your account grows from $10,000 to $12,000, then falls to $9,000 before it climbs again. The drop is $3,000, and $3,000 ÷ $12,000 = 25%.
That 25% is a drawdown: the fall from the highest value an account has reached to a later low, written as a percentage of that high.
It is measured from the peak, so it can be larger than your loss against the deposit. In this example you were only 10% below the $10,000 you started with.
The largest drawdown over a period is the maximum drawdown. It tells you how far an account or a strategy has fallen in the past.
Drawdown can be tracked on balance, which counts closed trades only, or on equity, which includes the profit or loss of open trades.
Equity drawdown is often the deeper of the two, because an open trade can sink far before it is closed.
Why does a loss need a bigger gain to recover?
A gain is earned on whatever balance is left after the loss. The deeper the loss, the smaller that balance, so the percentage needed to get back grows faster than the loss itself.
With the drawdown written as a decimal, the formula is:
Gain needed = drawdown ÷ (1 − drawdown)
For a 25% drawdown: 0.25 ÷ 0.75 = 0.333, a gain of 33.3%. For 50%: 0.50 ÷ 0.50 = 1, a gain of 100%.
| Drawdown | Balance left from $10,000 | Gain needed to break even |
|---|---|---|
| 10% | $9,000 | 11.1% |
| 20% | $8,000 | 25.0% |
| 25% | $7,500 | 33.3% |
| 30% | $7,000 | 42.9% |
| 40% | $6,000 | 66.7% |
| 50% | $5,000 | 100% |
| 60% | $4,000 | 150% |
| 75% | $2,500 | 300% |
| 90% | $1,000 | 900% |
Small drawdowns are close to symmetric: 10% down needs 11.1% up. At 30% down the gain needed is already 42.9%, and at 90% the account has to grow tenfold.
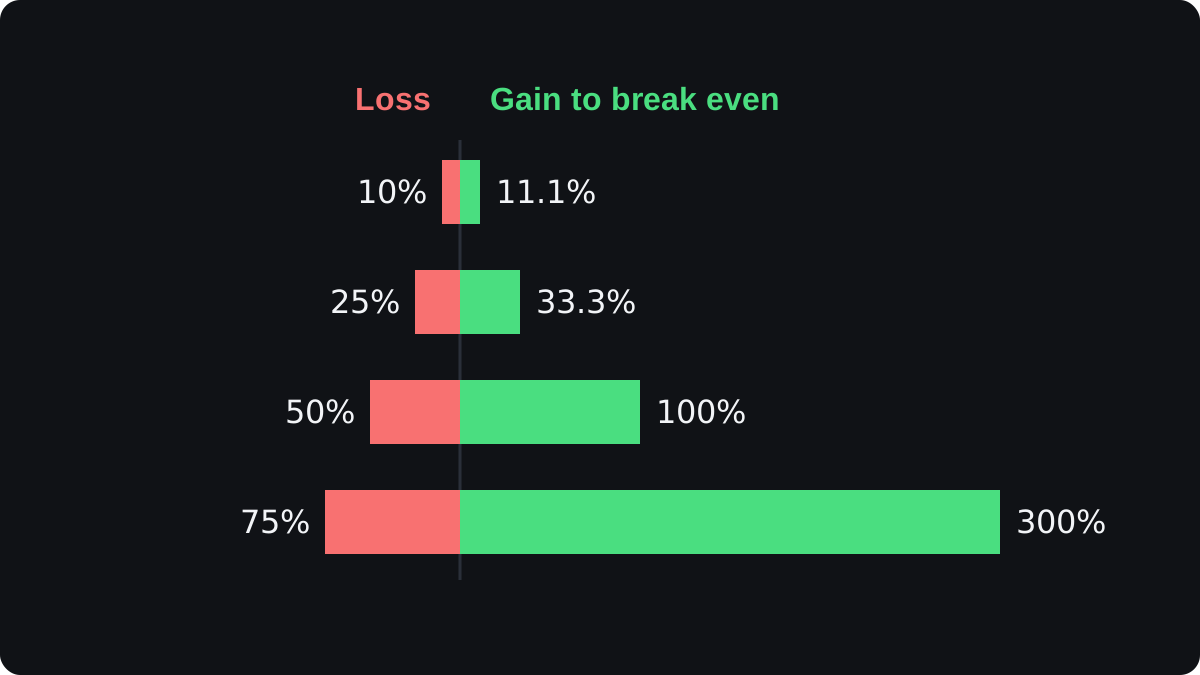
The drawdown calculator works out the gain needed for any drawdown you type in.
A worked example: down 50%, then up 50%
The numbers here are round and illustrative.
- You start with $10,000.
- A losing run costs 50%: $10,000 × 0.50 = $5,000 lost, leaving $5,000.
- You then gain 50%: $5,000 × 0.50 = $2,500 made, bringing you to $7,500.
- You are still $2,500 short, which is 25% below where you started.
- To reach $10,000 from $5,000 you need $5,000 of profit, and $5,000 ÷ $5,000 = 100%.
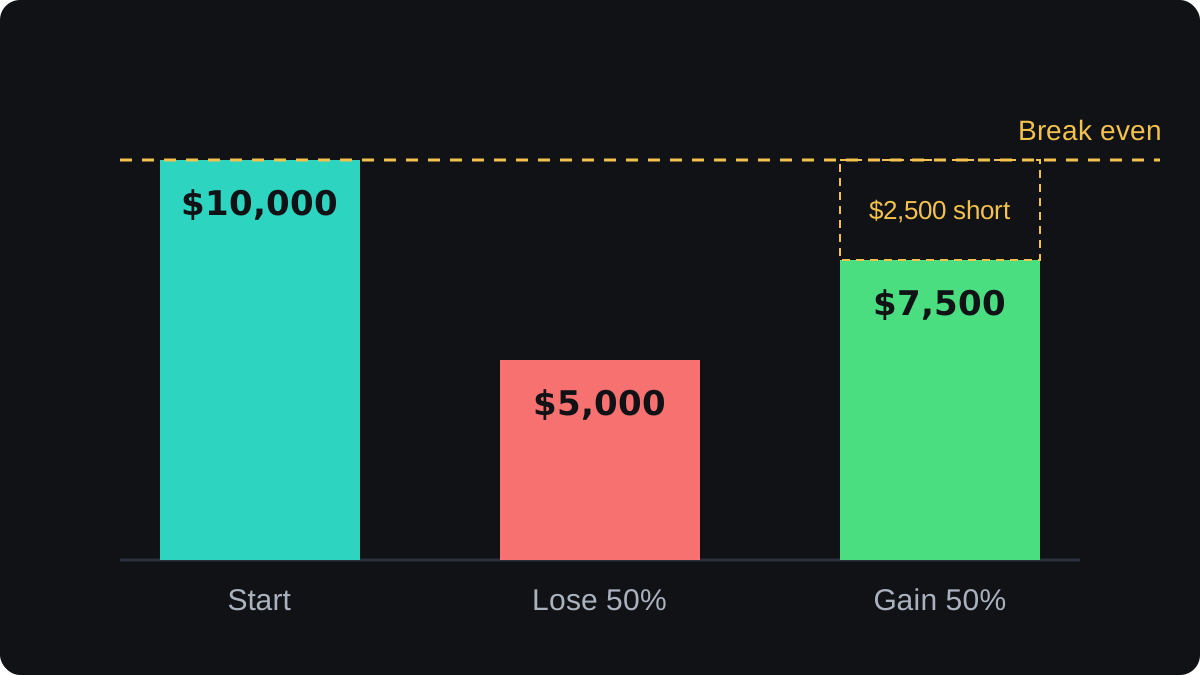
Changing the order gives the same result. Gain 50% first and you reach $15,000. Lose 50% after that and you land on $7,500 again, because 1.5 × 0.5 = 0.75.
Any equal percentage move up and down leaves you below the start. A 10% gain and a 10% loss give 1.1 × 0.9 = 0.99, a 1% shortfall.
How does a losing streak build a drawdown?
A drawdown is often a run of ordinary losing trades added together. Say you risk a fixed share of your current balance on each trade, the method the lesson on risk per trade covers next.
Each loss shrinks the balance, so the losses compound. After 10 losses in a row at 1% each, you keep 0.99 multiplied by itself 10 times, which is 0.904.
On $10,000 that leaves $9,043.82, a drawdown of 9.6%. The same streak at higher risk per trade looks like this:
| Risk per trade | Balance after 10 losses | Drawdown | Gain needed |
|---|---|---|---|
| 1% | $9,043.82 | 9.6% | 10.6% |
| 2% | $8,170.73 | 18.3% | 22.4% |
| 5% | $5,987.37 | 40.1% | 67.0% |
| 10% | $3,486.78 | 65.1% | 186.8% |
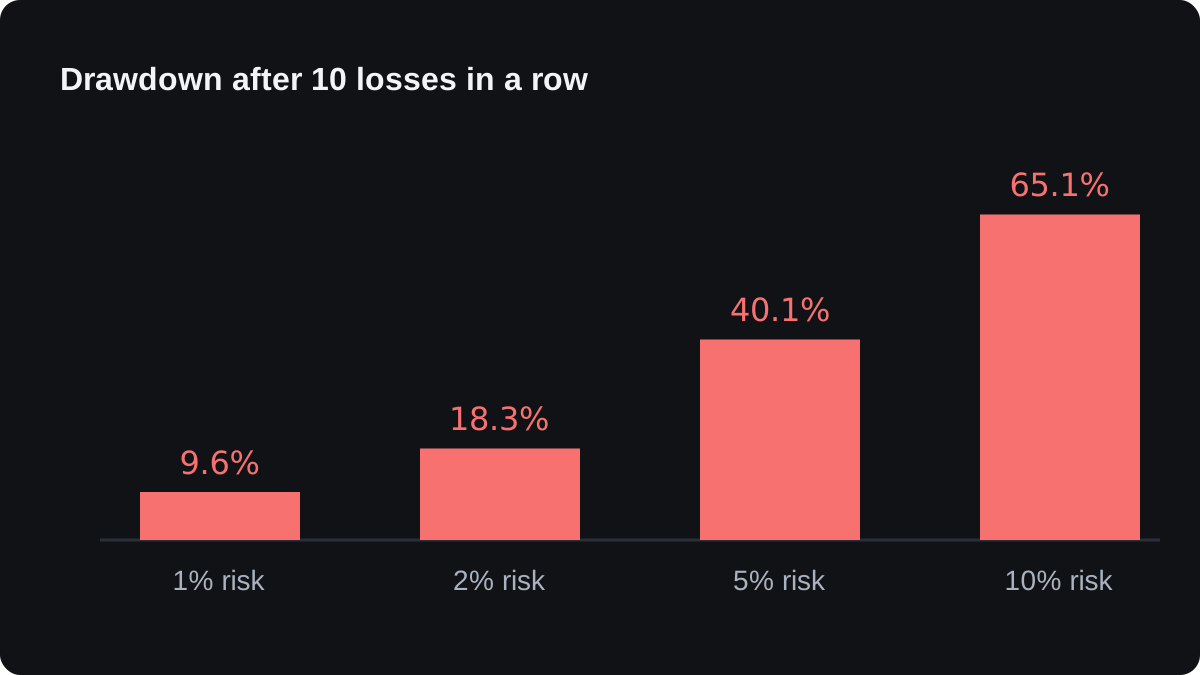
Ten times the risk per trade made the drawdown nearly seven times deeper. The gain needed to recover grew about 18 times, from 10.6% to 186.8%.
A streak of ten losses can happen to any strategy, including a sound one. What you control is whether the account survives it at the size you trade.
How long can a recovery take?
The table shows how much you must gain, but not how long it takes. Suppose, purely as an illustration, an account grows 2% every month with profits left in.
From a 20% drawdown you need 25%. At 2% a month that takes 12 months, because 1.02 to the power of 11 is only 1.243, and the 12th month brings it to 1.268.
From a 50% drawdown you need 100%. At 2% a month, 35 months gives 1.9999, so doubling takes just over 35 months, about three years.
Real returns are uneven, so read these as a sense of scale. The compounding calculator runs other rates.
Deep drawdowns also change behaviour. A trader far below the peak may raise position size to win it back faster, which makes a deeper fall more likely. The trading psychology lesson covers this habit.
On a leveraged account a deep drawdown can end trades for you. If equity falls far enough against the margin in use, the broker closes positions at the stop out level.
Setting a drawdown limit
One common safeguard is a personal drawdown limit. You choose a level, such as 10% or 20% below the peak, at which you stop trading and review what went wrong.
Those figures are examples, and the right level depends on you. Pick it before you trade, while you are calm, and write it into your plan with the action it triggers, for example halving your position size or moving back to a demo account.
If you base the limit on a strategy's test results, leave room beyond them. A backtest's maximum drawdown is the worst fall in past data, and a future drawdown can be deeper, as the lesson on backtesting a strategy explains.
សំណួរ
How do you calculate drawdown?
Subtract the low from the peak and divide by the peak. A fall from $12,000 to $9,000 is $3,000 ÷ $12,000 = 25%.
How much do I need to gain to recover from a 30% loss?
You need 42.9%. From $10,000 a 30% loss leaves $7,000, and $3,000 ÷ $7,000 = 42.9%.
Is drawdown the same as a loss?
No. A loss is measured against what you put in, while drawdown is measured from the account's highest point, so an account in overall profit can still be in a drawdown.
What is a good maximum drawdown?
No single number suits everyone, because it depends on your strategy and how much loss you can afford. Keep in mind that any drawdown beyond 20% needs a gain of more than 25% to undo.
Does drawdown include open trades?
Equity drawdown does, because equity includes the floating profit or loss of open positions. Balance drawdown counts closed trades only.
បន្តរៀន
 ជំពូក 1What is risk management in trading?Risk management is the set of rules, decided before you place an order, that limits how much you can lose on one trade and in total. It covers risk per trade, stop placement, position size and total exposure. Its job is keeping you trading through losing streaks, because no method wins every trade.
 ជំពូក 1How much to risk per trade.Risk per trade is the money you lose if a trade hits its stop loss. The fixed-percentage rule sets it as a share of your current balance, commonly 1% to 2%, so each loss shrinks the next bet. At 1%, ten losses in a row take a $10,000 account to about $9,044.
 ជំពូក 1Risk-reward ratio and win rate.The risk-reward ratio compares what a trade can lose with what it aims to win, and the win rate is the share of trades that win. Together they decide whether a strategy pays. The win rate you need to break even is risk divided by risk plus reward, so a 1:2 trade needs 33.3% before costs.

