Combining Fibonacci with candlestick patterns.
Combining Fibonacci with candlesticks means waiting for a reversal candle, such as a hammer or an engulfing pattern, to close at a retracement level before you enter. The level shows where a pullback might stop, and the candle shows buyers or sellers stepping in. The cost is a later entry, and the signal still fails often.
เนื้อหานี้ยังมีเฉพาะภาษาอังกฤษ

A Fibonacci retracement gives you a handful of prices where a pullback might stop. It cannot tell you which of them will hold, or whether any will.
A reversal candle that closes on one of those prices is a second piece of evidence. This lesson builds one trade around that idea, then covers what it costs and where it breaks down.
Why is a retracement level not enough on its own?
A retracement tool usually draws 23.6%, 38.2%, 50% and 61.8%, and it often shows 78.6% as well. The 50% line is included by custom, although it is not a Fibonacci ratio.
On a 100-pip swing, neighbouring levels from 23.6% to 78.6% sit only 11.8 to 16.8 pips apart. Almost any pullback will come near one of them, so a touch on its own tells you very little.
Price can turn at a level, or slice through it and keep going. Buying the moment price arrives is a bet on the first outcome before the market has shown anything.
A candle gives you something you can see. When it closes, you know whether buyers pushed price back up from the level. You pay for that evidence with a later entry.
The levels depend on which swing you measure, so get that step right first. The lesson on how to draw Fibonacci retracements covers it.
Which candles count as a reversal signal?
In an uptrend the pullback is a fall, so you watch for bullish reversal candles at the level:
- A hammer has a small body near the top of its range and a lower wick at least twice the body. Sellers pushed price down and buyers took it back.
- A bullish engulfing pattern is a green body that covers the whole body of the red candle before it.
- A morning star is three candles: a red one, a small one, then a green one that closes well into the first body.
- A doji opens and closes at almost the same price. It shows indecision, so it is weaker than the others and is often read together with the next candle.
In a downtrend the pullback is a rise, and you watch for the mirror images: the shooting star, the bearish engulfing pattern and the evening star.
Judge a candle only after it closes. A candle that has dipped through 61.8% with time still left on it can finish anywhere, including far below the level.
A worked example: a hammer at 61.8%
The prices below are round and illustrative, on a 4-hour EUR/USD chart. A pip on EUR/USD is 0.0001.
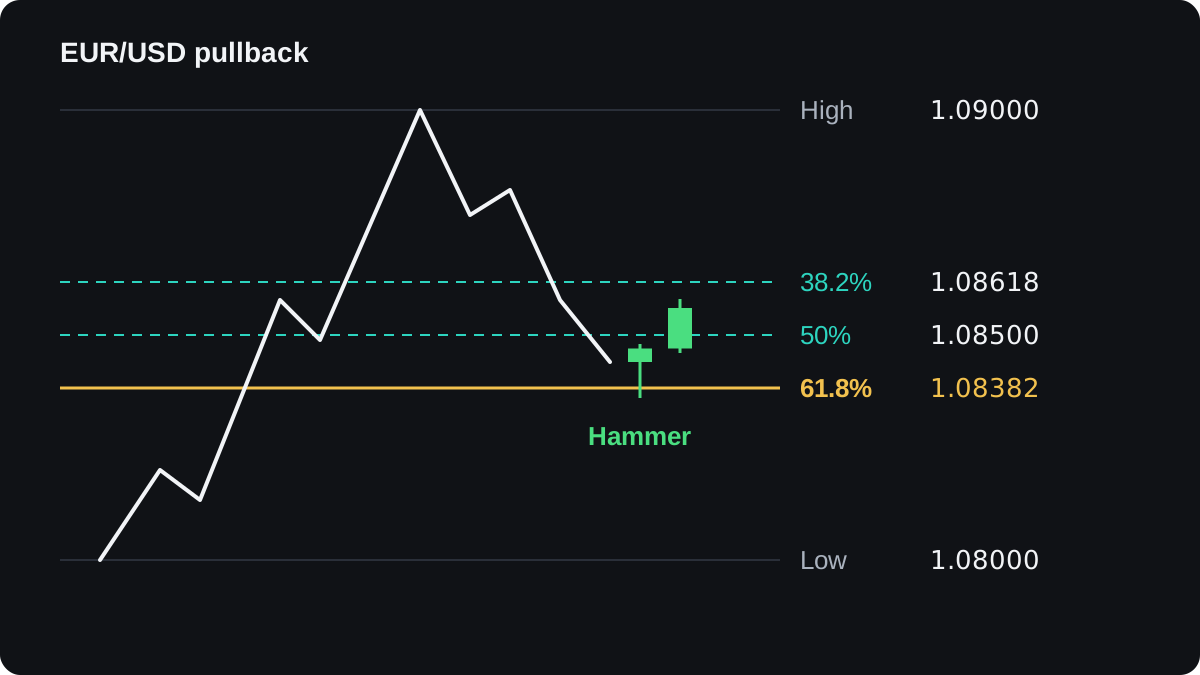
- EUR/USD rises from a swing low of 1.08000 to a swing high of 1.09000, a move of 100 pips.
- The 38.2% level is 38.2 pips below the high: 1.09000 minus 0.00382 = 1.08618.
- The 50% level is 1.09000 minus 0.00500 = 1.08500.
- The 61.8% level is 1.09000 minus 0.00618 = 1.08382.
- Price falls through 38.2% and 50% with no reversal candle at either.
- A candle opens at 1.08440, dips to 1.08360, has a high of 1.08480 and closes at 1.08470.
That candle's lower wick is 8 pips (1.08440 minus 1.08360), its body is 3 pips and its upper wick is 1 pip, so it qualifies as a hammer. Its low went 2.2 pips past 61.8% and it closed back above the level.
Now turn the candle into a plan:
- You buy at the open of the next candle. Assume it opens at the hammer's close, 1.08470.
- You place the stop 2 pips below the hammer's low, at 1.08340. The risk is 1.08470 minus 1.08340 = 0.00130, which is 13 pips.
- You aim for the swing high at 1.09000. The reward is 1.09000 minus 1.08470 = 0.00530, which is 53 pips.
- Reward to risk is 53 ÷ 13, about 4.1 to 1.
- On EUR/USD, 0.10 lot is worth $1 per pip, so 0.20 lot is $2 per pip. The stop would cost 13 × $2 = $26 and the target would pay 53 × $2 = $106.
These sums leave out the spread and any commission, which would make the loss a little larger and the gain a little smaller.
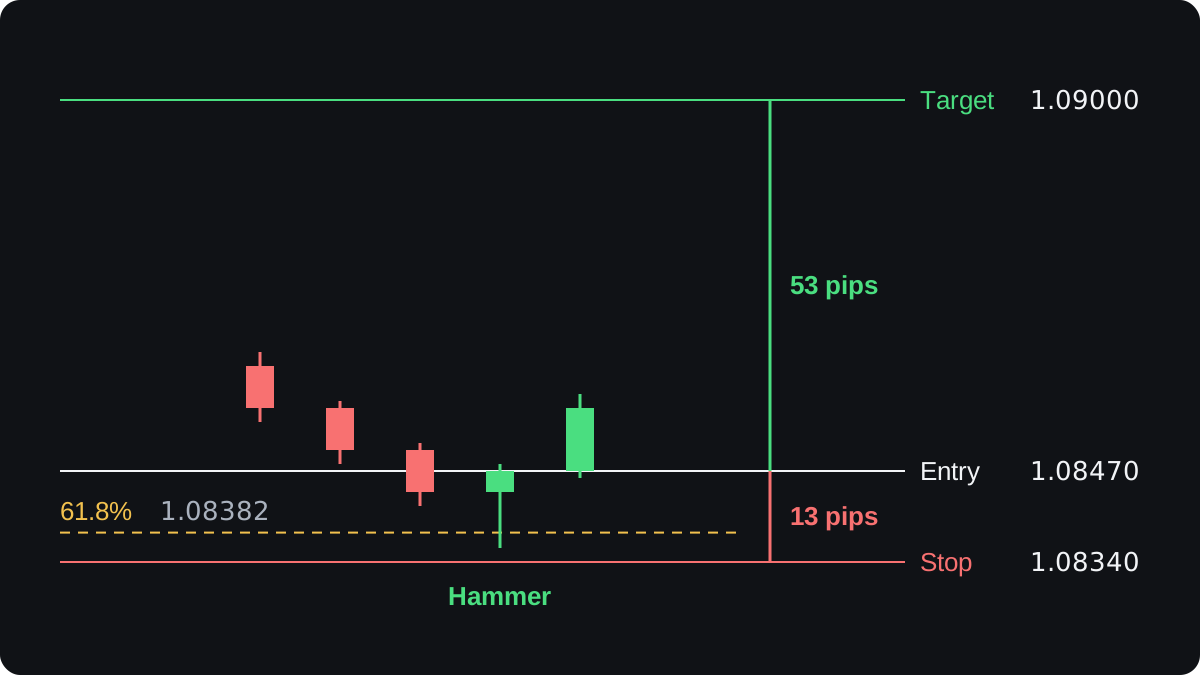
The candle set the stop as well as the entry. Its low is the price the market tested and rejected, so a move below it removes the reason for the trade.
Placing stops with Fibonacci levels covers other ways to choose the stop, and Fibonacci extensions give targets beyond the old high.
What does waiting for the candle cost?
Compare two traders. One places a limit buy at 1.08382, the 61.8% level. The other waits for a bullish candle to close.
If price turns as in the example, the limit order fills at 1.08382, which is 8.8 pips better than the 1.08470 entry. The patient trader gave up those pips for confirmation.
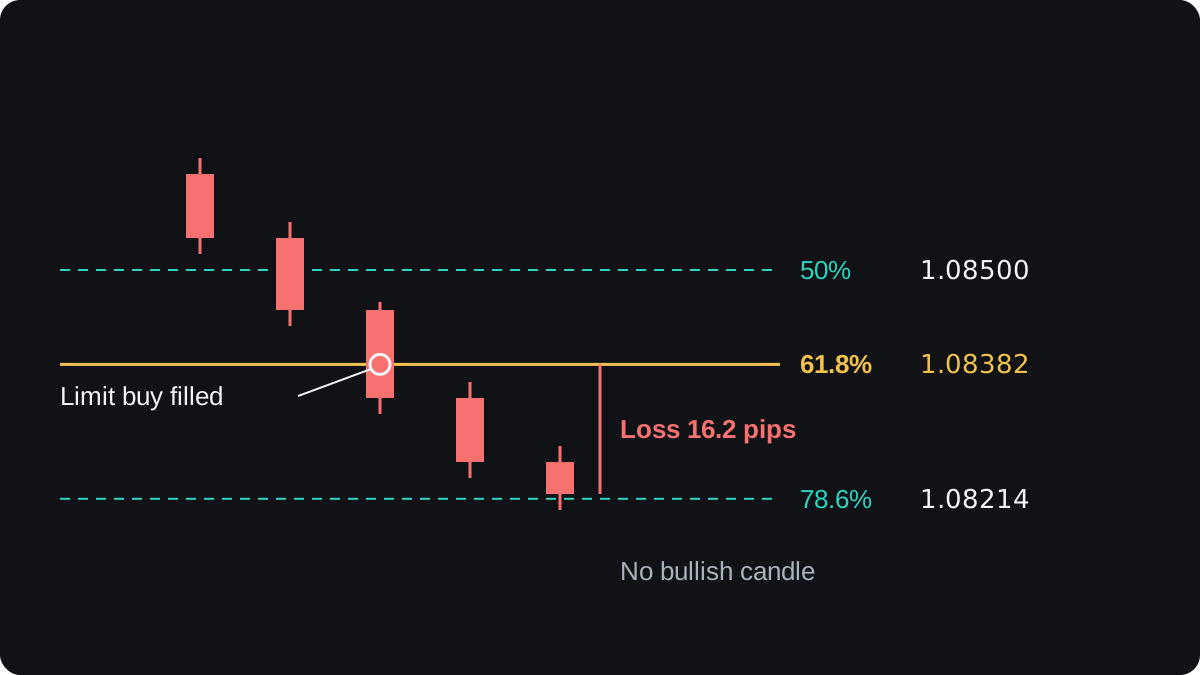
Now suppose no bullish candle appears. Price closes through 61.8% and slides past the 78.6% level at 1.08214, with a low of 1.08200, and the last candle closes at 1.08220.
The limit order filled on the way down and is now 1.08382 minus 1.08220 = 16.2 pips in loss. The trader who waited never entered.
| Approach | Price turns at 61.8% | Price keeps falling |
|---|---|---|
| Limit buy at 1.08382 | Fills 8.8 pips better | Fills, then 16.2 pips down |
| Wait for a bullish candle | Enters at 1.08470 | No signal, no trade |
Waiting also skips some trades that would have worked. Price sometimes turns with no clean pattern, and a hammer with a very long wick can push the stop too far away for the size you planned.
Where does the combination fail?
A reversal candle at a level still fails often. The candle after a hammer can close below the hammer's low, and that is the case the stop is there for.
The evidence for either tool is thin. Tests of candlestick patterns on their own have given mixed and mostly weak results, and there is no solid proof that markets respect Fibonacci ratios as special numbers.
Two weak signals together are not automatically a strong one. Whether this pairing adds anything on your pair and timeframe is something only your own testing can show.
Other failures come from the setup itself or from the market around it:
- A hammer on a 5-minute chart at a level drawn on the daily chart says little about the daily swing. Decide in advance which timeframe the candle must come from.
- Two traders who measure different swings get different levels, and both can find a candle at one of them.
- A major economic release can carry price through the candle's low in seconds, whatever the candle looked like.
- A gap at the weekly open can jump straight past your stop, so the loss can be larger than planned.
Turning the idea into written rules
Before you test this on past charts, write each choice down so you cannot bend it later:
- The timeframe, and how you pick the swing low and swing high.
- The levels you act on, for example only 50% and 61.8%.
- The candles that count, with measurable definitions, such as a lower wick at least twice the body.
- How close to the level the candle must reach, for example a low within 3 pips of it.
- The entry trigger, the stop distance beyond the wick and the target.
The entry trigger changes the numbers. A buy stop 1 pip above the hammer's high, at 1.08490, fills only if price keeps rising, and it moves the risk from 13 pips to 15.
The Fibonacci calculator gives the levels for any swing. Then run your rules over past charts and log every signal, losers included; how to backtest a strategy explains the process.
คำถามที่พบบ่อย
Which Fibonacci level works best with candlestick patterns?
No level has been shown to be best. The 38.2%, 50% and 61.8% levels are the ones usually drawn, and whether any of them suits your pair is a question for your own backtest.
Should I enter when the candle closes or wait for the next one?
Both methods are used. Entering at the next open takes the closed candle as it is, while a buy stop above its high waits for price to move your way and fills slightly worse: 1.08490 instead of 1.08470 in the example.
What if the reversal candle forms between two levels?
Follow your written rule. If its low is not within the distance you set from a level, treat it as no signal.
Does a doji at a Fibonacci level mean price will reverse?
No. A doji shows that buyers and sellers were balanced for that candle, so it is a weak signal on its own, and you can require the next candle to close in the new direction before acting.
เรียนต่อ
 บทที่ 3What are Fibonacci retracement levels?Fibonacci retracement levels are lines drawn at fixed percentages of a price move to mark how deep a pullback has gone. The usual levels are 23.6%, 38.2%, 50%, 61.8% and 78.6%. The middle three get the most attention, but the evidence that price turns at them more than anywhere else is weak.
 บทที่ 3How to draw Fibonacci retracements.In an uptrend, draw a Fibonacci retracement from the swing low to the swing high, so the levels sit below the high. In a downtrend, draw from the swing high to the swing low, so the levels sit above the low. Use the clear extremes of one completed move, wick to wick.
 บทที่ 3Combining Fibonacci with support and resistance.Combining Fibonacci with support and resistance means checking whether a retracement level sits on a price the market has reacted to before, such as an old high. When the two line up within a few pips, traders call it a confluence zone and watch it more closely. Price can still break straight through a zone.
 บทที่ 3Combining Fibonacci with trend lines.A Fibonacci retracement offers several levels where a pullback might stop. A trend line through earlier swing lows, or swing highs in a downtrend, narrows the choice: watch the level the line crosses around the time price returns to it. That meeting point is a zone of interest, and price can still break through it.
 บทที่ 3Fibonacci extensions for profit targets.A Fibonacci extension projects how far a trend might run after a pullback. You measure the first swing, multiply it by ratios such as 61.8%, 100% and 161.8%, and add each result to the low of the pullback. Traders use the levels as possible take-profit targets, with no guarantee that price reaches them.
 บทที่ 3Placing stops with Fibonacci levels.A Fibonacci stop goes beyond the next retracement level past your entry, plus a small buffer for the spread and noise. Buy at 50% and the stop sits under 61.8%; sell at 50% and it sits above 61.8%. Then cut the lot size so the wider stop still risks only the money you planned.
 บทที่ 3Fibonacci cheat sheet.Fibonacci retracement levels are 23.6%, 38.2%, 50%, 61.8% and 78.6% of the last swing, drawn from swing low to swing high in an uptrend. Extensions such as 127.2% and 161.8% project targets. A single level is weak evidence, so look for confluence, and stops usually sit beyond the level or the swing.

