Why keep a trading journal?
A trading journal is a written record of every trade, with the reason, the plan and your state of mind next to the price and result. It turns wins and losses into data you can sort, showing which habits make money and which lose it, something your account balance alone cannot show.
เนื้อหานี้ยังมีเฉพาะภาษาอังกฤษ

Two traders can finish a month with the same $150 gain and learn very different amounts from it. The one who kept a journal can see which trades made the money and which gave it back, something a balance alone cannot show.
A trading journal is a record of every trade you take, written at the time, with the reasons and conditions behind it as well as the numbers.
Its purpose is to turn a pile of wins and losses into data you can sort and question.
What does a journal record that your platform does not?
Your trading platform already keeps a history. In MetaTrader, for example, the account history lists each trade's symbol, size, open and close prices, and the profit or loss.
That history tells you what happened. It cannot tell you why you opened the trade, whether it matched your plan, or how you felt when you closed it early.
A journal adds those missing columns. Some are plain facts, such as the setup you traded or the session. Others are honest notes, such as "entered after two losses to win it back".
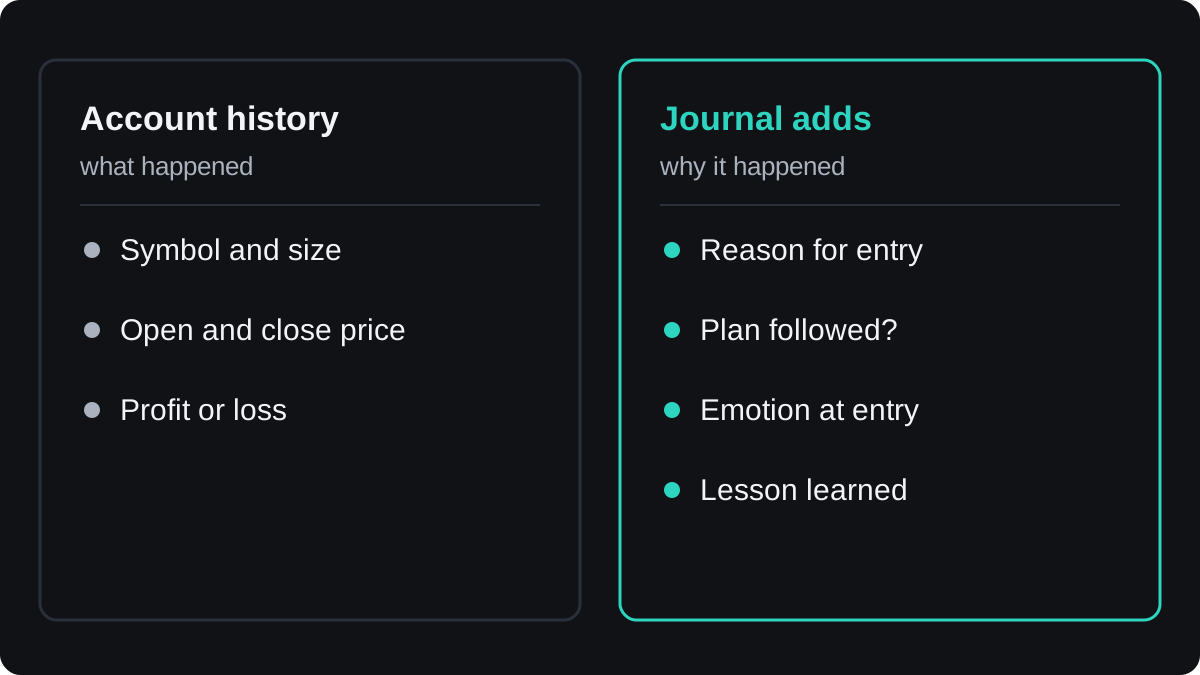
The next lesson, what to record in a trading journal, goes through the fields one by one. This lesson is about why the extra effort is worth making.
Why memory is a weak record of your trades
Memory keeps stories better than numbers. A large win or a painful loss can stay vivid for weeks, while the ten ordinary trades around it blur together.
Memory also edits itself. Once you know how a trade ended, it is easy to believe you saw it coming, a habit psychologists call hindsight bias.
An entry written before the outcome is known is much harder to rewrite. If your note says "unsure, small size", that is what you thought, whatever the price did next.
This matters most for the trades you would rather forget. Impulsive entries, moved stops and revenge trades are the ones memory quietly drops, and they can be where a large share of the losses sit.
The lesson on trading psychology basics looks at why those trades happen.
A worked example: one month, two stories
The month below has 20 trades. The numbers are illustrative, chosen to show the method, and each result already includes trading costs.
Without a journal, the trader sees a balance that rose by $150. With a journal, every trade also carries one tag: planned, meaning it followed the written plan, or unplanned, meaning it did not.
- Count the totals. There were 9 wins worth $810 in total and 11 losses worth $660 in total.
- Find the net result: $810 − $660 = $150. Over 20 trades that is $150 ÷ 20 = $7.50 per trade on average.
- Sort by tag. The 12 planned trades had 7 wins worth $665 and 5 losses worth $270, so they netted $665 − $270 = +$395.
- The 8 unplanned trades had 2 wins worth $145 and 6 losses worth $390, so they netted $145 − $390 = −$245.
- Check that the parts add up: $395 − $245 = $150, the same as the total.
| Group | Trades | Wins | Losses | Win rate | Net result | Per trade |
|---|---|---|---|---|---|---|
| Planned | 12 | 7 | 5 | 58% | +$395 | +$32.92 |
| Unplanned | 8 | 2 | 6 | 25% | −$245 | −$30.63 |
| All trades | 20 | 9 | 11 | 45% | +$150 | +$7.50 |
The win rates come from wins divided by trades: 7 ÷ 12 = 58%, 2 ÷ 8 = 25% and 9 ÷ 20 = 45%. The per trade figures are the net result divided by the number of trades.
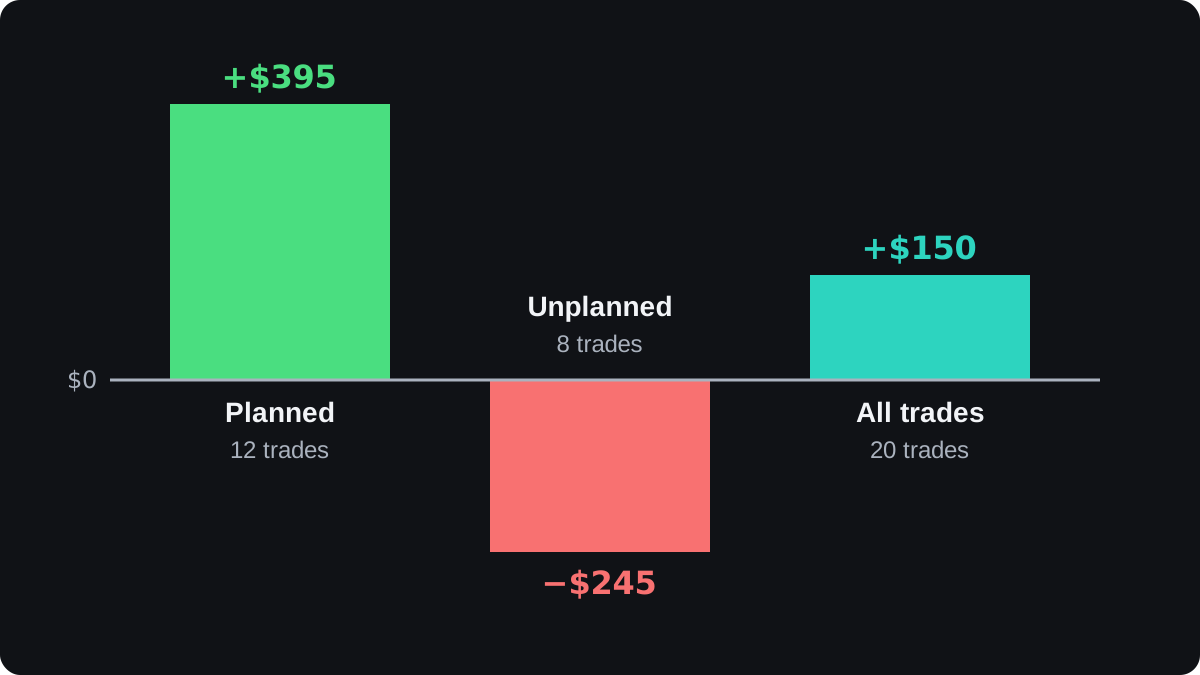
The balance said the month was a modest success. The journal says the planned trades made $395 and the unplanned ones gave more than half of it back.
Win rate and the size of each win and loss work together, so a 45% win rate can still make money. The lesson on risk-reward ratio and win rate explains how.
What a journal can and cannot tell you
A journal shows you patterns in your own past trades. It does not tell you what the market will do next, and it cannot turn a losing method into a winning one.
Small samples are the main trap. Eight unplanned trades are far too few to prove anything, and 2 wins in 8 can happen by chance even when the trades were reasonable.
Treat a pattern like this one as a question to test. The fair next step is to keep tagging and see whether the gap holds over the next 50 or 100 trades.
A journal is also only as honest as the person writing it. If you tag a trade as planned because you wish it had been, the data will flatter you.
How a journal turns results into changes
The records help only when you use them. A simple loop is enough: log every trade, tag it, compare the groups at the end of each week or month, then test one change.
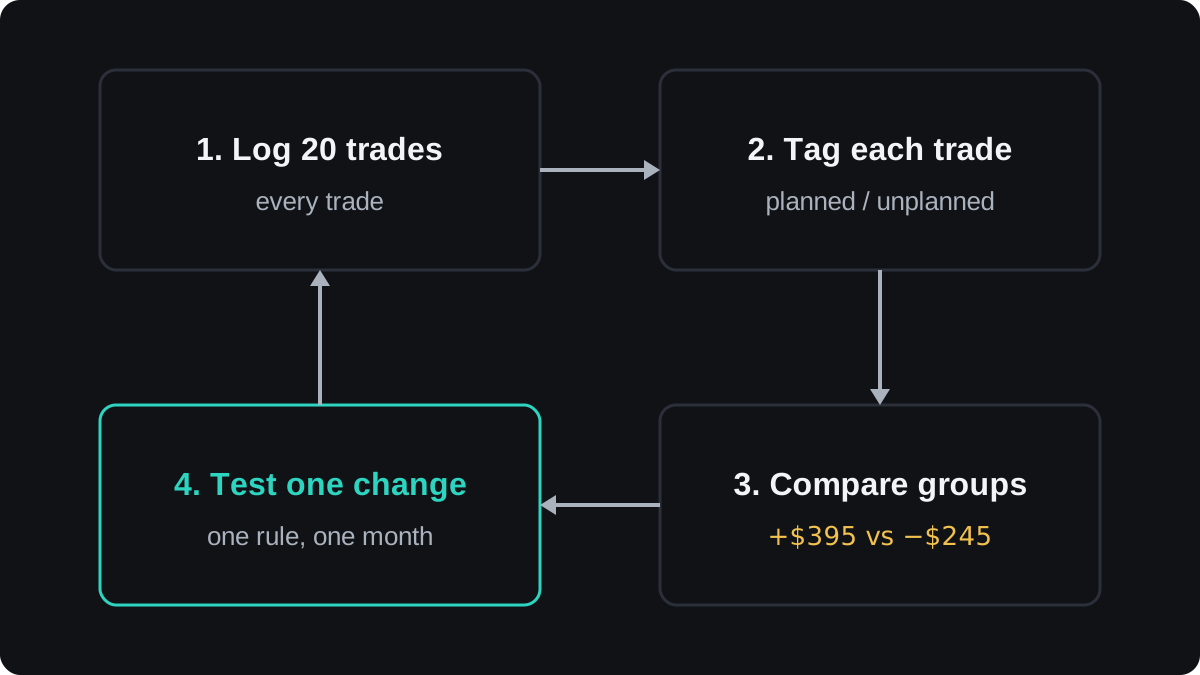
In the example, the change to test could be a rule of no trades outside the written plan for the next month. Changing one thing at a time lets the journal show whether that change made a difference.
A journal also makes slow problems visible. A steady rise in trades per week can be a sign of overtrading, and costs that look tiny on one trade become clear when you total them across a month.
Your trading plan sets the rules, and forward testing on a demo account gives you trades to log without risking money.
The last lesson in this module, reviewing your trades, covers how to run the review itself.
คำถามที่พบบ่อย
Do I need a trading journal if my platform saves my history?
The platform history records prices, sizes and results. It does not record why you traded or whether you followed your plan, and those are the columns that explain the results.
Should I keep a journal on a demo account?
Yes. Demo trades cost nothing, so they are a good place to build the habit, and the records show how a method behaves before real money is involved.
Can I use a spreadsheet as a trading journal?
Yes. A spreadsheet with one row per trade is enough for most people and makes totals by tag easy. A notebook or a journal app also works, as long as every trade goes in.
How many trades before a journal shows anything useful?
There is no fixed number. A few dozen trades can hint at a pattern, but a small group, such as 8 trades with one tag, can easily reflect chance, so keep recording before you act on it.
Does keeping a journal make you profitable?
No. It shows what you are doing and how it turned out. Whether results improve depends on the changes you make and on the method itself.
เรียนต่อ
 บทที่ 4What to record in a trading journal.A trading journal entry should record why you took the trade, the pair, direction, entry, stop and target, the size and money at risk, the exit and why, every cost, and the net result as a multiple of your risk. Add whether you followed your plan and how you felt, so you can tell good decisions from lucky ones.
 บทที่ 4Reviewing your trades.A trade review is a fixed weekly check of your journal. You grade each trade on whether it followed your plan, measure results in R, the multiple of planned risk, tag every rule break, and count the tags over several weeks to find the mistake you repeat most, then fix one rule at a time.

