Commodity currencies.
Commodity currencies belong to countries whose exports lean on raw materials: the Australian dollar with iron ore and coal, the Canadian dollar and Norwegian krone with oil, and the New Zealand dollar with dairy. Higher export prices tend to lift these currencies, but the link is loose and changes strength over time.
Nội dung này hiện chỉ có bản tiếng Anh.

When the price of crude oil climbs, the Canadian dollar often firms against the US dollar. When iron ore slides, the Australian dollar often weakens.
Traders call these commodity currencies: the currencies of countries whose exports depend heavily on raw materials. The link is real, but it is loose, and its strength changes over time.
Which currencies are commodity currencies?
Four currencies come up most often. The Australian dollar (AUD) follows iron ore, coal and natural gas, and Australia is also a large gold producer.
The Canadian dollar (CAD) follows crude oil, Canada's largest export, most of which is sold to the United States. The Norwegian krone (NOK) also moves with oil and gas.
The New Zealand dollar (NZD) moves with dairy prices, because milk powder and other dairy products are New Zealand's biggest goods export.
AUD, CAD and NZD are often grouped as the commodity bloc, and the country profile covers each in depth.
Some emerging market currencies follow commodities too, such as the Chilean peso with copper, though local politics can drown out that link.
Why does a commodity price move a currency?
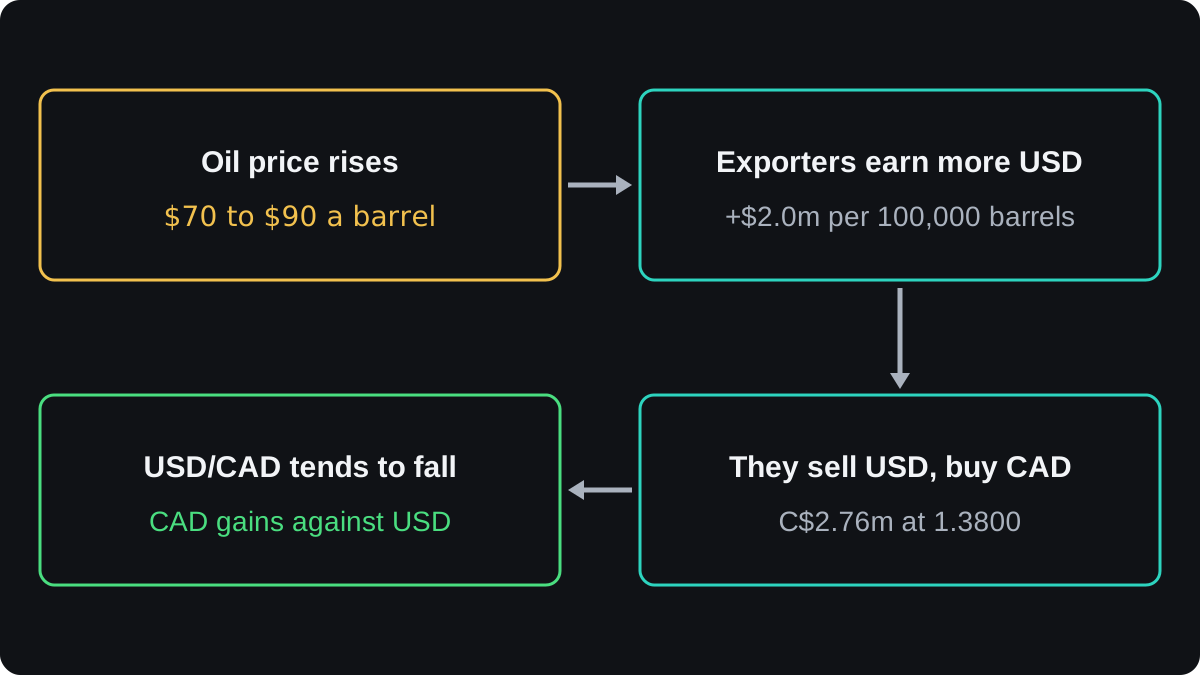
Start with one cargo of oil. Oil is priced in US dollars, so a Canadian producer selling 100,000 barrels at $70 receives $7.0 million. At $90, the same cargo brings in $9.0 million.
The producer pays wages and taxes in Canadian dollars, so much of that income is sold for CAD. At an illustrative USD/CAD rate of 1.3800, the extra $2.0 million becomes C$2.76 million of new demand for the Canadian dollar.
Repeat that across a whole industry and the flow is large enough to push the exchange rate. The chain runs from the commodity price to the currency.
Economists describe the wider effect with the terms of trade: the price of what a country exports compared with the price of what it imports.
When export prices rise faster than import prices, the country earns more for the same output, and its currency tends to gain.
There is also a rates channel. Strong export income can lift wages, spending and inflation, so the central bank may keep interest rates higher than it otherwise would. Higher expected rates attract foreign money, which supports the currency.
How do you read the direction on a chart?
The quote order decides whether a stronger commodity currency pushes the chart up or down. AUD and NZD are quoted first against the dollar, so AUD/USD and NZD/USD rise when those currencies strengthen.
CAD and NOK are quoted second, as USD/CAD and USD/NOK. When oil lifts the Canadian dollar, one US dollar buys fewer Canadian dollars, so USD/CAD falls.
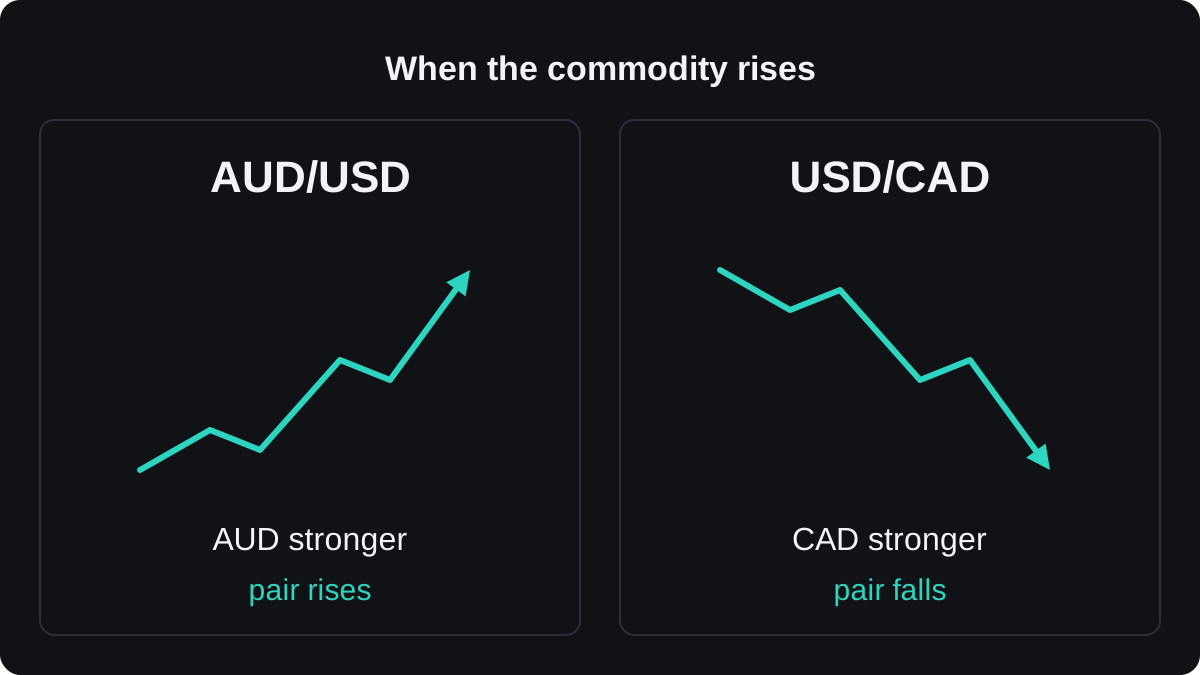
The usual pairings look like this:
| Currency | Linked exports | Usual pair | If the commodity rises, the pair tends to |
|---|---|---|---|
| AUD | Iron ore, coal, gas, gold | AUD/USD | Rise |
| CAD | Crude oil | USD/CAD | Fall |
| NZD | Dairy | NZD/USD | Rise |
| NOK | Oil and gas | USD/NOK | Fall |
The last column says tends to for a reason. Over days and weeks, the pair can move the other way for long stretches.
A worked example: an oil view on USD/CAD
Say oil has been rising and you expect the Canadian dollar to follow. You sell 0.10 lot of USD/CAD at 1.3800. The prices are round and illustrative, and the spread is left out to keep the arithmetic clear.
- A standard lot is 100,000 units of the base currency, so 0.10 lot is US$10,000.
- A pip on USD/CAD is 0.0001, so one pip is worth 10,000 × 0.0001 = C$1.
- USD/CAD falls to 1.3650 and you buy back to close: 1.3800 minus 1.3650 = 0.0150, which is 150 pips.
- 150 × C$1 = C$150. In a US dollar account, that is 150 ÷ 1.3650 = $109.89.
Now take a second branch. Oil keeps rising, but strong US data lifts the US dollar, and USD/CAD climbs to 1.3920 instead.
- 1.3920 minus 1.3800 = 0.0120, a loss of 120 pips, or C$120.
- In a US dollar account, that is 120 ÷ 1.3920 = $86.21 lost.
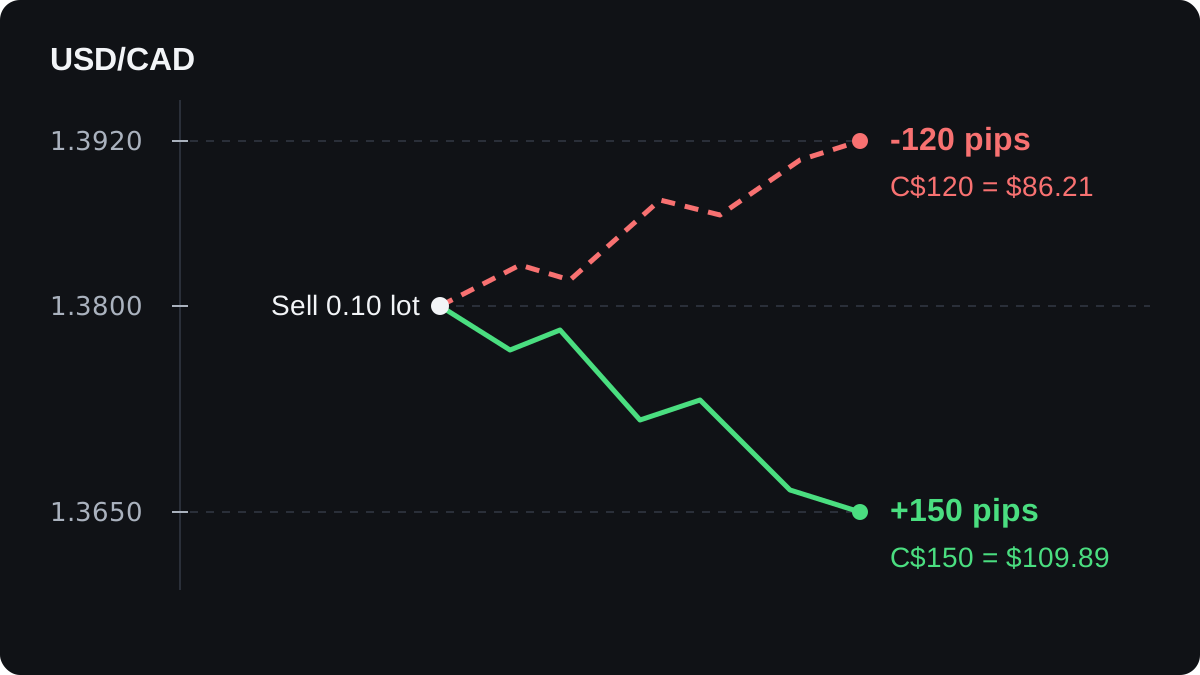
Oil went up in both branches. Only the US dollar side of the pair differed, and it decided the result. The profit and loss calculator repeats these sums for other pairs and sizes.
Why does the link break?
A pair holds two currencies, and the commodity speaks to only one of them. The US dollar can move on its own news, as the second branch showed.
The dollar can also drive both sides at once. Most commodities are priced in dollars, so a weaker dollar tends to push their dollar prices up just as AUD/USD rises.
In that case the two lines move together because of a third factor, the dollar, and neither one caused the other.
Risk mood is another shared driver. When investors expect faster global growth they tend to buy both commodities and growth-linked currencies, and they sell both when fear rises. The risk-on, risk-off lesson covers that pattern.
Local details weaken the link further. Much of Canada's crude is heavy oil that sells at a discount to the US benchmark, and that discount changes, so headline oil prices can overstate what Canada earns.
Norway puts a large share of its oil income into a state fund that invests abroad, so not all of that money is turned into krone.
Central banks can outweigh prices. If the Bank of Canada cuts rates while oil is rising, the cut can matter more to CAD than the oil move.
Timing is the last problem. Markets price expected changes early, so by the time a commodity rally makes the news, the currency may already reflect it.
Evidence for a dependable link over hours or days is weak. It tends to show more clearly over months.
How can you check the link yourself?
Measure it before you rely on it. A correlation coefficient runs from -1 to +1 and shows how closely two prices moved together over a chosen window. The currency correlation lesson explains how to read one.
Compare a short window with a long one. If a 20-day reading and a 200-day reading disagree, the relationship has probably shifted recently, and an old rule of thumb may be out of date.
Crosses can take the US dollar out of the comparison. AUD/CAD sets a metals and coal exporter against an oil exporter, so it reflects relative commodity strength more than US news, though each side still has its own central bank and local data.
Commodity news also lands on a schedule. Weekly US oil inventory figures and national trade balances can move these currencies, so check the calendar before holding a trade through them.
Gold has its own long relationship with the US dollar, which the next lesson, gold and the US dollar, takes apart.
Câu hỏi thường gặp
What is a commodity currency?
It is the currency of a country whose exports rely heavily on raw materials, so its value tends to move with their prices. The Australian, Canadian and New Zealand dollars and the Norwegian krone are the usual examples.
Why does the Canadian dollar move with oil?
Crude oil is Canada's largest export and is sold in US dollars. Higher oil prices bring in more dollars that are converted into Canadian dollars, and they improve Canada's terms of trade.
Why does USD/CAD go down when oil goes up?
The Canadian dollar is the second currency in the pair. When oil strengthens CAD, one US dollar buys fewer Canadian dollars, so the USD/CAD price falls.
Does the Australian dollar follow gold?
Gold is one influence, since Australia is a large gold producer. Iron ore is usually Australia's largest export, and coal and gas also matter, so gold alone explains little of the AUD.
Can you trade AUD or CAD from commodity prices alone?
That is a thin basis for a trade. The US dollar, risk mood and central bank decisions can override the commodity link for long stretches, so test the relationship on your own data first.
Học tiếp
 Chương 2Bond yields and currencies.A bond yield is the return a government bond pays at its current price. The yield spread is one country's yield minus another's. When the spread moves in a currency's favour, that currency often strengthens, sometimes after a delay. The link is common but unreliable, and it can break in panics and debt scares.
 Chương 2Gold and the US dollar.Gold is priced in US dollars, so a weaker dollar tends to raise the gold price and a stronger dollar tends to lower it. US real interest rates often push gold and the dollar in opposite directions too. The link often breaks: in a crisis both can rise together, and heavy gold buying can lift gold in every currency.

