Placing stops with Fibonacci levels.
A Fibonacci stop goes beyond the next retracement level past your entry, plus a small buffer for the spread and noise. Buy at 50% and the stop sits under 61.8%; sell at 50% and it sits above 61.8%. Then cut the lot size so the wider stop still risks only the money you planned.
Nội dung này hiện chỉ có bản tiếng Anh.
You bought EUR/USD on a pullback to a Fibonacci level, and now the platform asks for a stop loss.
If it sits too close, an ordinary dip can close the trade just before price turns your way. If it sits too far away, one loss can cost more than you planned.
A common answer is to place the stop beyond the next Fibonacci level, with a small buffer, and then size the position so the wider stop still risks a fixed amount of money.
Why does a stop right under your entry get hit?
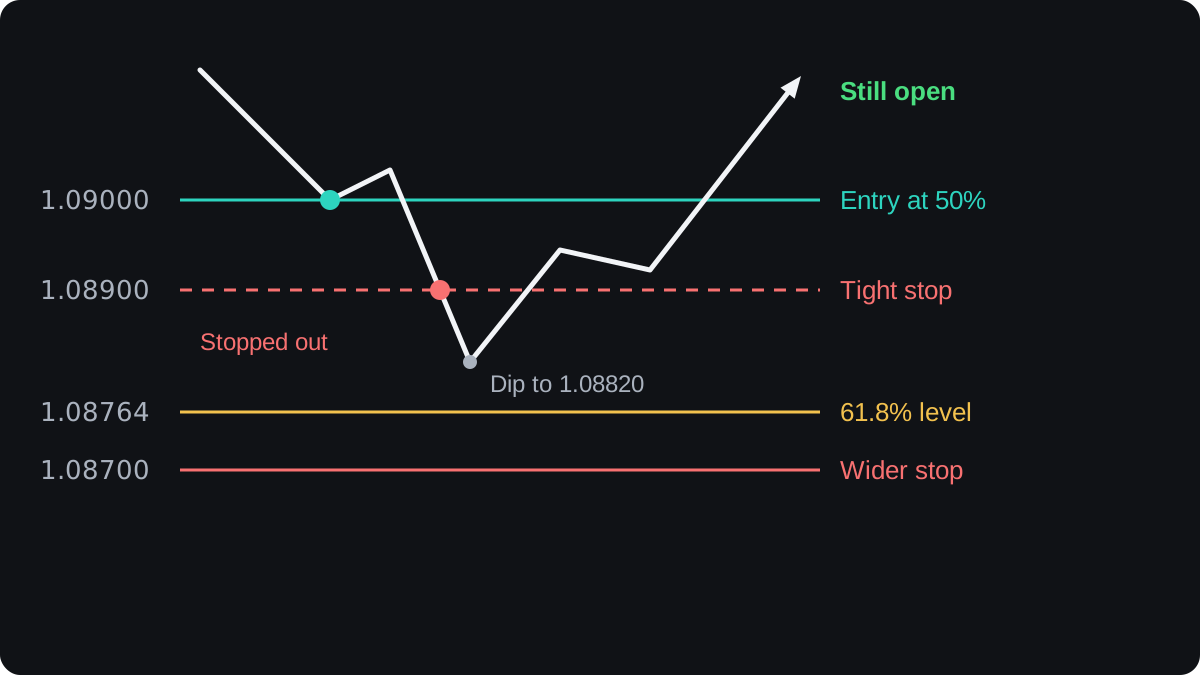
Take an illustrative swing: EUR/USD rises from 1.08000 to 1.10000, then pulls back. The 50% retracement sits at 1.09000. You buy there and put your stop 10 pips lower, at 1.08900.
Price dips to 1.08820, which triggers your stop, and then climbs back above 1.09000. Your read of the pullback was fine, yet the stop closed the trade first.
Price rarely turns at the exact Fibonacci number. A level behaves more like a zone, and wicks often poke through it by several pips before the market turns. The retracement levels lesson explains where the numbers come from.
In this example the dip stopped above the next level, the 61.8% retracement at 1.08764. A stop placed a little under that level, at 1.08700, was never touched.
Where should a Fibonacci stop go?
Place the stop beyond the next Fibonacci level past your entry. On a buy that means below it, and on a sell it means above it.
- Entry at 38.2%: stop beyond 50%, or beyond 61.8% for more room.
- Entry at 50%: stop beyond 61.8%.
- Entry at 61.8%: stop beyond 78.6%, or beyond the swing point at 100%.
A pullback that only reaches the next level is still an ordinary pullback, so the trade stays open. If price pushes past it, the retracement is deeper than your plan allowed, and the case for the trade is weaker.
The stop beyond 100% has the plainest meaning. On a buy, a break below the swing low undoes the whole rise you measured, so the setup no longer exists.
Two of these levels are not Fibonacci ratios. 50% is simply halfway, and 78.6% is the square root of 0.618. Charting tools include both by custom.
How big should the buffer be?
The buffer is the extra distance between the level and your stop. It should cover the spread and the normal noise around a level, and no single number is correct for every pair.
One method is to scale it to recent volatility, for example a fraction of the Average True Range. The volatility lesson shows how that is measured.
On a buy, your stop triggers when the bid reaches it. On a sell, it triggers on the ask, which sits above the bid by the spread.
So on a sell trade, a stop placed exactly on a level can trigger while the bid is still below that level.
Worked example: a buy on EUR/USD
Use the same illustrative swing from 1.08000 to 1.10000. On EUR/USD a pip is 0.0001, so the range is 200 pips, and each retracement is measured down from the high.
- 38.2% of 200 pips is 76.4 pips: 1.10000 minus 0.00764 = 1.09236.
- 50% is 100 pips: 1.10000 minus 0.01000 = 1.09000.
- 61.8% is 123.6 pips: 1.10000 minus 0.01236 = 1.08764.
- 78.6% is 157.2 pips: 1.10000 minus 0.01572 = 1.08428.
You buy at 1.09000. The next level down is 1.08764, and you set the stop at 1.08700, a buffer of 6.4 pips. The stop distance is 1.09000 minus 1.08700 = 0.00300, which is 30 pips.
Say the account holds $5,000 and you risk 1% per trade, an example figure, which is $50. On EUR/USD in a US dollar account, one standard lot is worth $10 per pip.
- Divide the risk by the stop: $50 ÷ 30 pips = $1.67 per pip.
- At $10 per pip per lot, that is 0.167 lot. Round down to 0.16 lot, worth $1.60 per pip.
- If the stop is hit, the loss is 30 × $1.60 = $48.00.
Rounding down keeps the loss under your limit. The position size lesson covers the method for other pairs, and the lot size calculator does the sum for you.
The same $50 limit gives very different sizes for different stops:
| Stop placement | Stop price | Distance | Size for $50 | Loss if hit |
|---|---|---|---|---|
| Just under 50% | 1.08900 | 10 pips | 0.50 lot | $50.00 |
| Under 61.8% | 1.08700 | 30 pips | 0.16 lot | $48.00 |
| Under swing low | 1.07950 | 105 pips | 0.04 lot | $42.00 |
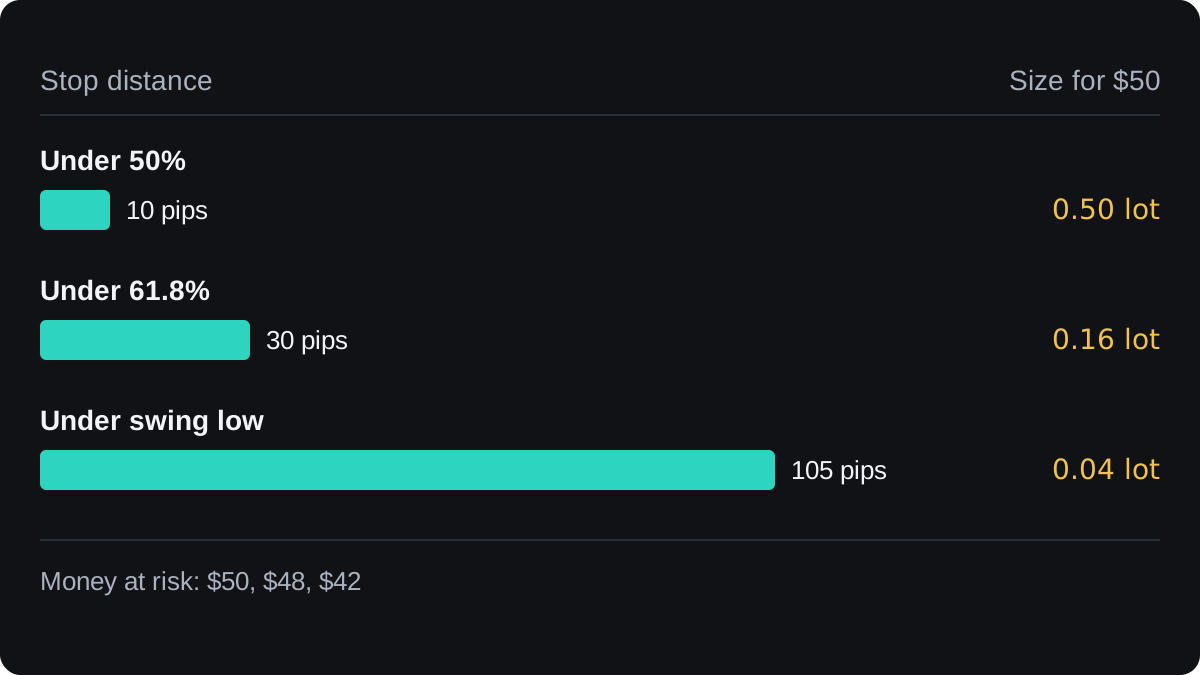
A wider stop does not have to mean a bigger loss. You trade a smaller size, and the money at risk stays close to your limit.
The stop also changes the balance of the trade. If you aim for the old high at 1.10000, the target is 100 pips away, about 3.3 times the 30 pip stop.
With the 105 pip stop, the same target is slightly smaller than the risk. These sums ignore spread and commission, and the extensions lesson covers targets beyond the old high.
A sell on USD/JPY: the same rule turned over
In a downtrend you measure from the swing high to the swing low and sell the bounce. Say USD/JPY falls from 150.00 to 148.00. A yen pip is 0.01, so that is 200 pips.
The retracements now count up from the low. 50% is 148.00 plus 1.00 = 149.00, and 61.8% is 148.00 plus 1.236 = 149.236.
You sell at 149.00 and place the stop above the 61.8% level, at 149.30, a buffer of 6.4 pips. The distance is 149.30 minus 149.00 = 0.30, which is 30 pips.
On 0.10 lot a yen pip is worth ¥100 (10,000 dollars × 0.01), so hitting the stop costs 30 × ¥100 = ¥3,000. At 149.30 yen per dollar that is about $20.09 in a US dollar account.
In the figure the bounce peaks at 149.18, under the 61.8% level, and the stop holds.
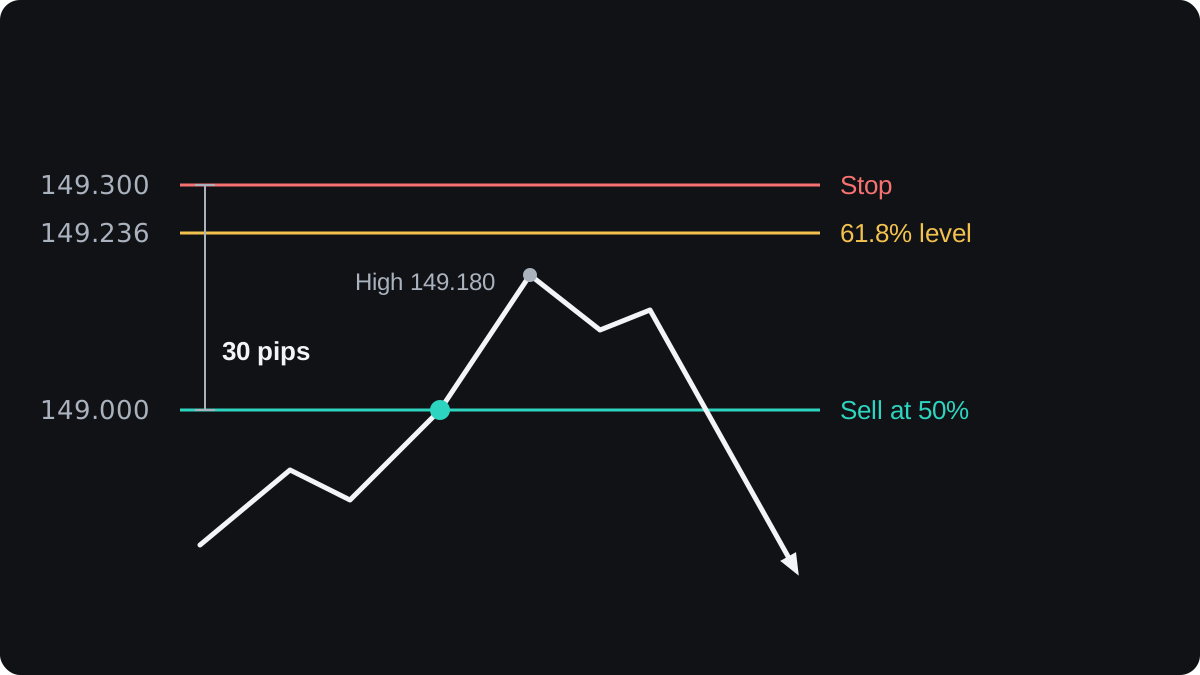
This stop is watched on the ask. If the spread widens around a news release, the ask can reach 149.30 while the chart, which usually draws bid prices, still shows a high below it.
Where Fibonacci stops fall short
Fibonacci levels mark common pullback depths, and there is little solid evidence that price respects them more than other levels. A stop beyond 61.8% gives the trade room, yet nothing makes the pullback end there.
Your levels depend on the swing you pick. Two people who choose different highs and lows get different levels and different stops, which is why the drawing lesson matters.
A stop is on firmer ground when it agrees with something else on the chart, such as a swing low or a support zone. The lesson on Fibonacci with support and resistance shows how to check for that overlap.
A stop loss closes at the next available price. After a weekend gap or a fast news move, the fill can be worse than your stop, which is called slippage.
If the next level is so far away that even 0.01 lot risks more than you planned, you can pass on the trade. Moving the stop closer to fit your account puts it back inside normal noise.
Câu hỏi thường gặp
Should my stop go on the Fibonacci level or beyond it?
Beyond it, with a small buffer. Price often trades a few pips past a level before turning, so a stop placed exactly on it can be hit by ordinary movement.
Which Fibonacci level is best for a stop loss?
No level is best for every trade. The stop usually goes beyond the level after your entry, such as 61.8% when you buy at 50%, or beyond the swing low or high when you want the whole setup to be proven wrong first.
How many pips should the buffer be?
There is no fixed number. It should at least cover the spread, and you can scale it to recent volatility, for example with the Average True Range.
Does a wider stop mean a bigger risk?
Only if you keep the same lot size. If you cut the size so the stop distance times the pip value stays within your limit, the money at risk stays about the same.
Do Fibonacci stops work?
They give a stop a reasoned place, but they cannot make a pullback end at any level. Treat them as one method for placing stops and test it on a demo account before using real money.
Học tiếp
 Chương 3What are Fibonacci retracement levels?Fibonacci retracement levels are lines drawn at fixed percentages of a price move to mark how deep a pullback has gone. The usual levels are 23.6%, 38.2%, 50%, 61.8% and 78.6%. The middle three get the most attention, but the evidence that price turns at them more than anywhere else is weak.
 Chương 3How to draw Fibonacci retracements.In an uptrend, draw a Fibonacci retracement from the swing low to the swing high, so the levels sit below the high. In a downtrend, draw from the swing high to the swing low, so the levels sit above the low. Use the clear extremes of one completed move, wick to wick.
 Chương 3Combining Fibonacci with support and resistance.Combining Fibonacci with support and resistance means checking whether a retracement level sits on a price the market has reacted to before, such as an old high. When the two line up within a few pips, traders call it a confluence zone and watch it more closely. Price can still break straight through a zone.
 Chương 3Combining Fibonacci with trend lines.A Fibonacci retracement offers several levels where a pullback might stop. A trend line through earlier swing lows, or swing highs in a downtrend, narrows the choice: watch the level the line crosses around the time price returns to it. That meeting point is a zone of interest, and price can still break through it.
 Chương 3Combining Fibonacci with candlestick patterns.Combining Fibonacci with candlesticks means waiting for a reversal candle, such as a hammer or an engulfing pattern, to close at a retracement level before you enter. The level shows where a pullback might stop, and the candle shows buyers or sellers stepping in. The cost is a later entry, and the signal still fails often.
 Chương 3Fibonacci extensions for profit targets.A Fibonacci extension projects how far a trend might run after a pullback. You measure the first swing, multiply it by ratios such as 61.8%, 100% and 161.8%, and add each result to the low of the pullback. Traders use the levels as possible take-profit targets, with no guarantee that price reaches them.
 Chương 3Fibonacci cheat sheet.Fibonacci retracement levels are 23.6%, 38.2%, 50%, 61.8% and 78.6% of the last swing, drawn from swing low to swing high in an uptrend. Extensions such as 127.2% and 161.8% project targets. A single level is weak evidence, so look for confluence, and stops usually sit beyond the level or the swing.

