How to draw Fibonacci retracements.
In an uptrend, draw a Fibonacci retracement from the swing low to the swing high, so the levels sit below the high. In a downtrend, draw from the swing high to the swing low, so the levels sit above the low. Use the clear extremes of one completed move, wick to wick.
Nội dung này hiện chỉ có bản tiếng Anh.
A Fibonacci retracement tool needs two clicks. Pick the wrong two points and every level it draws is wrong, however neat it looks on the chart.
Which point you click first depends on the direction of the trend, and a drawing stops being useful once the move it measures has changed.
What do the two anchor points measure?
The tool measures one completed price move. The first anchor is where the move started and the second is where it ended. The levels then show how much of that move price has given back.
The previous lesson listed the usual ratios: 23.6%, 38.2%, 50%, 61.8% and 78.6%. A 38.2% retracement means price has handed back 38.2% of the distance it travelled.
The arithmetic is the same in both directions. Each level is the end price, moved back toward the start by that share of the move's size.
How do you pick a swing high and a swing low?
Look at a peak where the candles on both sides have lower highs. That peak is a swing high. A swing low is the mirror image: a trough with higher lows on both sides. The market structure lesson covers both in more detail.
A common working rule asks for at least two candles on each side. You can use three or five instead, as long as you use the same number every time.
Before you click, check these points:
- The move between the two anchors runs clearly in one direction.
- The swing at the end is complete, so price has already turned away from it.
- Each anchor is the true extreme: the lowest low and the highest high of the move, not a candle beside it.
- You use wicks for both anchors, or bodies for both, and never mix them.
Wicks record the actual highest and lowest prices traded, which makes them the natural choice for most charts.
The timeframe decides which swings count. A clear swing on a 15 minute chart can be a small wiggle on the daily chart, so draw on the chart you use to make decisions.
How do you draw it in an uptrend?
In an uptrend you click the swing low first, then drag to the swing high. You are measuring the rise, so the levels appear below the high, where a pullback might pause.
Take an illustrative EUR/USD rise from a swing low of 1.08000 to a swing high of 1.10000. Work it out step by step:
- The size of the move is 1.10000 minus 1.08000 = 0.02000, which is 200 pips.
- 38.2% of 200 pips is 76.4 pips, so the level is 1.10000 minus 0.00764 = 1.09236.
- 50% of 200 pips is 100 pips, so the level is 1.10000 minus 0.01000 = 1.09000.
- 61.8% of 200 pips is 123.6 pips, so the level is 1.10000 minus 0.01236 = 1.08764.
The full set of levels for this move:
| Level | Pips back from the high | EUR/USD price |
|---|---|---|
| 0% (end of move) | 0 | 1.10000 |
| 23.6% | 47.2 | 1.09528 |
| 38.2% | 76.4 | 1.09236 |
| 50% | 100.0 | 1.09000 |
| 61.8% | 123.6 | 1.08764 |
| 78.6% | 157.2 | 1.08428 |
| 100% (start of move) | 200.0 | 1.08000 |
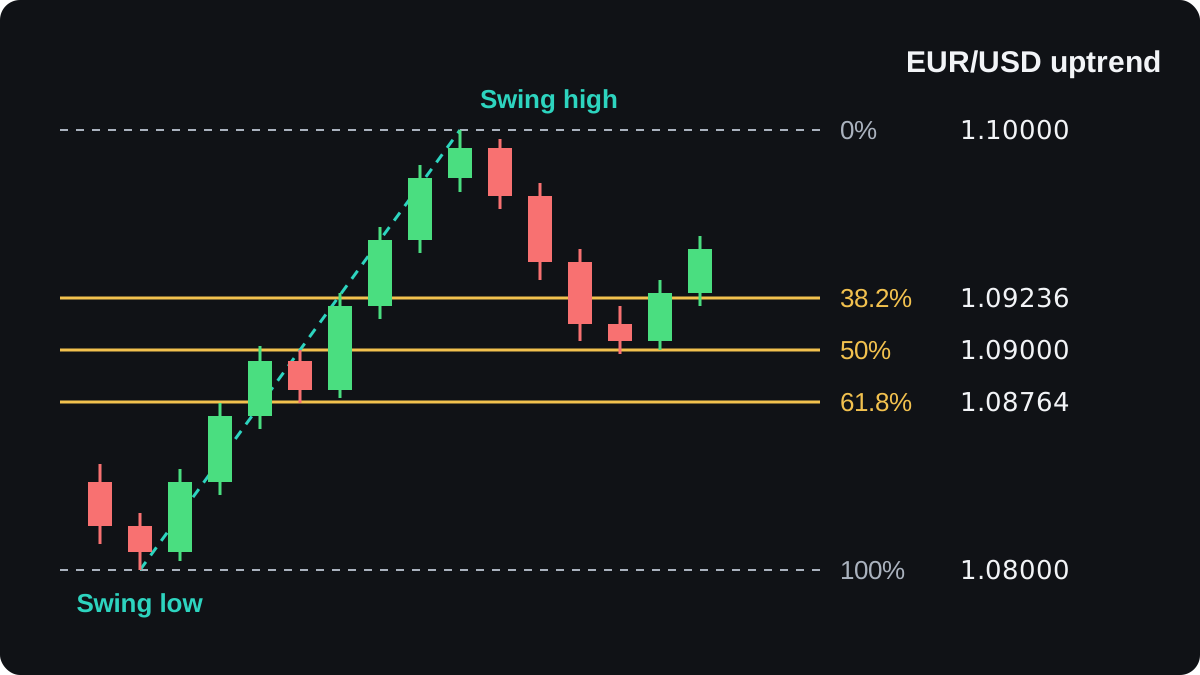
Your platform should print the same prices beside its lines. Some platforms label the end of the move 0% and others label it 100%, so trust the prices, and check that the 23.6% line sits closest to the swing high.
The Fibonacci calculator gives the same levels from two prices, which is a quick way to test a drawing.
How do you draw it in a downtrend?
A downtrend reverses the order. You click the swing high first, then drag down to the swing low. The levels now appear above the low, where a bounce might stall.
Take an illustrative USD/JPY fall from a swing high of 152.000 to a swing low of 148.000. On a yen pair one pip is 0.01.
- The size of the move is 152.000 minus 148.000 = 4.000, which is 400 pips.
- 38.2% of 400 pips is 152.8 pips, so the level is 148.000 plus 1.528 = 149.528.
- 50% of 400 pips is 200 pips, so the level is 148.000 plus 2.000 = 150.000.
- 61.8% of 400 pips is 247.2 pips, so the level is 148.000 plus 2.472 = 150.472.
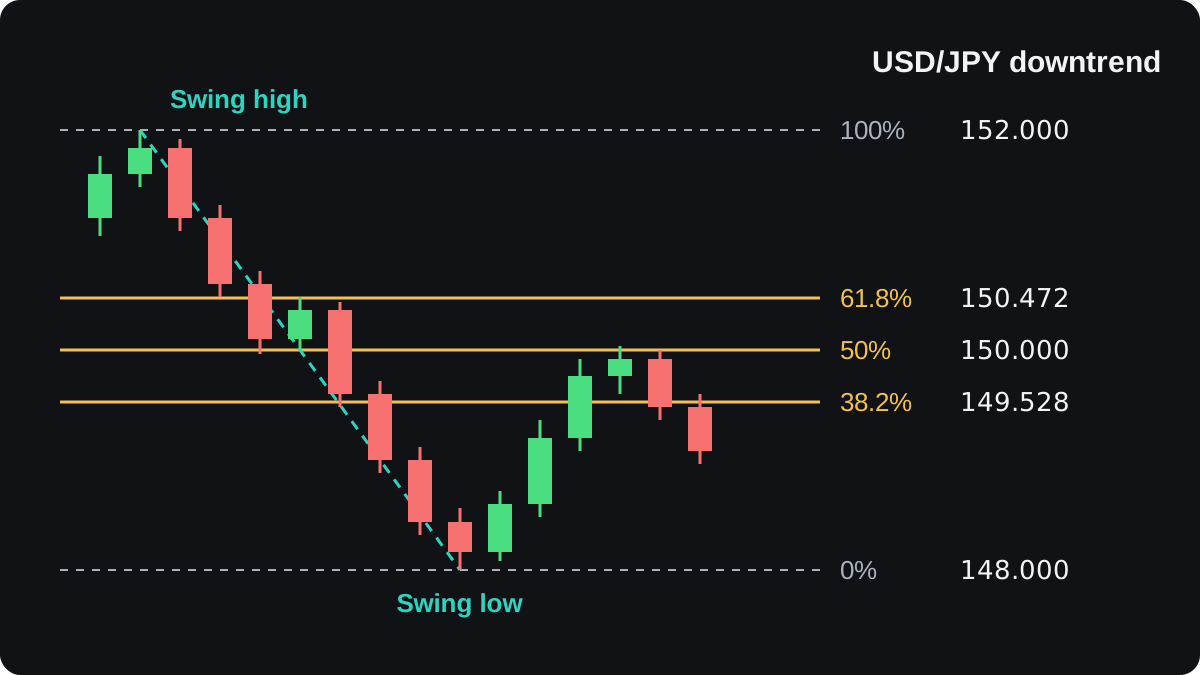
In the downtrend the 61.8% level is the highest of the three. A bigger retracement here means a bigger bounce up from the low.
One rule covers both cases: the first click goes on the start of the move and the second on its end. Which way you drag on screen follows from that.
When should you redraw or drop the levels?
A drawing belongs to one move. When the move changes, the drawing has to change too.
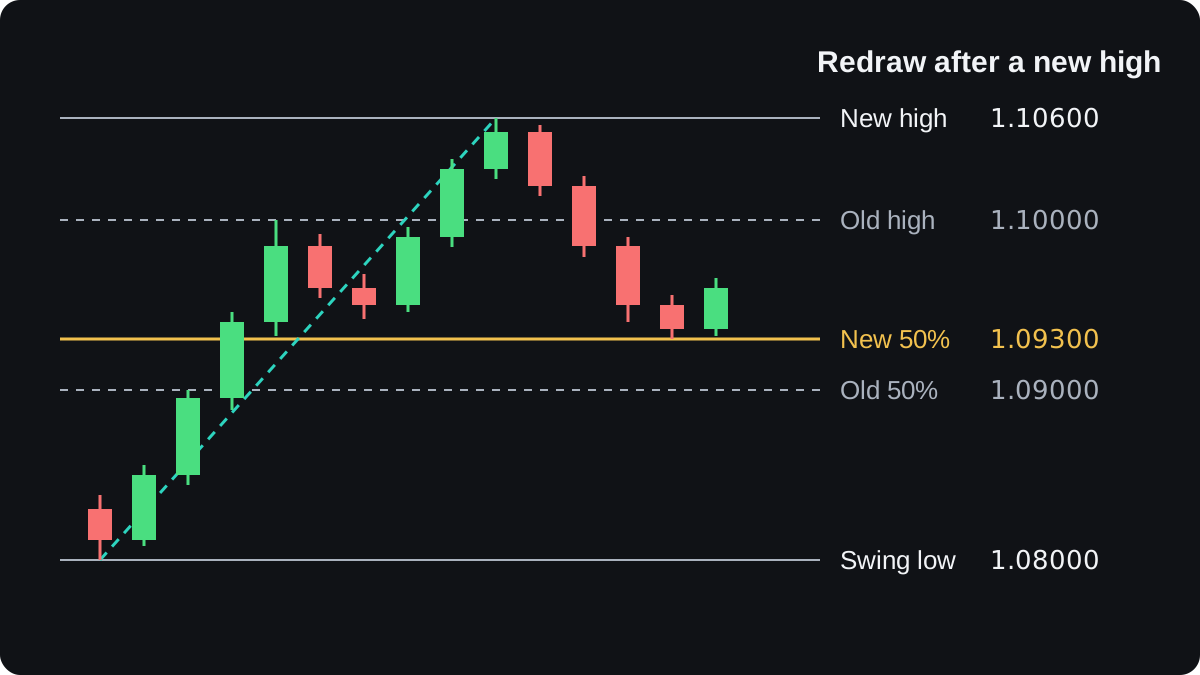
Say the EUR/USD rise pauses, then climbs to a new high of 1.10600. The old high is no longer the end of the move, so you keep the swing low at 1.08000 and move the second anchor up.
The move is now 1.10600 minus 1.08000 = 260 pips. Half of that is 130 pips, so the new 50% level is 1.10600 minus 0.01300 = 1.09300, which is 30 pips above the old 50% level at 1.09000.
Price can also break the other way. If an uptrend pullback falls below the swing low, the 100% level, it has erased the whole rise, and levels drawn on that rise no longer describe a pullback.
Sideways markets fit the tool poorly. With no clear trend, any pair of points you choose is arbitrary, so read the trending versus ranging lesson before you draw.
What mistakes make the levels misleading?
Several errors come from the clicks themselves:
- Anchoring on a candle near the extreme instead of the extreme itself, which shifts every level, sometimes by many pips.
- Clicking in the wrong order, which swaps the 38.2% and 61.8% labels, so a shallow pullback reads as a deep one.
- Moving the anchors until a line touches a candle. The fit then comes from your editing and tells you nothing new about price.
- Reading a line as an exact price. Treat each level as a zone a few pips wide, as with support and resistance zones.
Be realistic about what the levels can do. With five or six lines spread across a pullback, price will often sit near one of them by chance.
Published evidence that Fibonacci ratios mark turning points better than other evenly spaced levels is thin and mixed. One argument for them is that many chart users watch the same prices, and that idea is hard to test.
So it helps to look for a second, separate reason at the same price. The next lesson pairs Fibonacci levels with support and resistance.
Câu hỏi thường gặp
Do you draw Fibonacci from wick to wick or body to body?
Wick to wick is the more natural choice, because wicks mark the actual high and low. Body to body also works if you use it for both anchors every time.
Which way do you drag the Fibonacci tool in a downtrend?
Start at the swing high and drag down to the swing low. The retracement levels then appear above the low.
What timeframe should I draw Fibonacci on?
Use the timeframe you make trading decisions on. Levels from a daily swing cover a much larger move than levels from a 15 minute swing, and the two sets can disagree.
Why are my Fibonacci levels upside down?
Either you clicked in the wrong order, or your platform labels the end of the move 100% instead of 0%. Check that the 23.6% line sits closest to the end of the move.
Should I redraw Fibonacci when price makes a new high?
Yes, if you are measuring that trend. Keep the swing low and move the upper anchor to the new high, which moves every level up.
Học tiếp
 Chương 3What are Fibonacci retracement levels?Fibonacci retracement levels are lines drawn at fixed percentages of a price move to mark how deep a pullback has gone. The usual levels are 23.6%, 38.2%, 50%, 61.8% and 78.6%. The middle three get the most attention, but the evidence that price turns at them more than anywhere else is weak.
 Chương 3Combining Fibonacci with support and resistance.Combining Fibonacci with support and resistance means checking whether a retracement level sits on a price the market has reacted to before, such as an old high. When the two line up within a few pips, traders call it a confluence zone and watch it more closely. Price can still break straight through a zone.
 Chương 3Combining Fibonacci with trend lines.A Fibonacci retracement offers several levels where a pullback might stop. A trend line through earlier swing lows, or swing highs in a downtrend, narrows the choice: watch the level the line crosses around the time price returns to it. That meeting point is a zone of interest, and price can still break through it.
 Chương 3Combining Fibonacci with candlestick patterns.Combining Fibonacci with candlesticks means waiting for a reversal candle, such as a hammer or an engulfing pattern, to close at a retracement level before you enter. The level shows where a pullback might stop, and the candle shows buyers or sellers stepping in. The cost is a later entry, and the signal still fails often.
 Chương 3Fibonacci extensions for profit targets.A Fibonacci extension projects how far a trend might run after a pullback. You measure the first swing, multiply it by ratios such as 61.8%, 100% and 161.8%, and add each result to the low of the pullback. Traders use the levels as possible take-profit targets, with no guarantee that price reaches them.
 Chương 3Placing stops with Fibonacci levels.A Fibonacci stop goes beyond the next retracement level past your entry, plus a small buffer for the spread and noise. Buy at 50% and the stop sits under 61.8%; sell at 50% and it sits above 61.8%. Then cut the lot size so the wider stop still risks only the money you planned.
 Chương 3Fibonacci cheat sheet.Fibonacci retracement levels are 23.6%, 38.2%, 50%, 61.8% and 78.6% of the last swing, drawn from swing low to swing high in an uptrend. Extensions such as 127.2% and 161.8% project targets. A single level is weak evidence, so look for confluence, and stops usually sit beyond the level or the swing.

