Using moving averages to read the trend.
A moving average gives two trend readings. Price above the line means the latest close is higher than the average, and price below means lower. The line's slope shows whether the average itself is rising or falling. When both point the same way, the trend reading is clear; when they disagree, it is mixed.
Nội dung này hiện chỉ có bản tiếng Anh.

A moving average turns a jumpy price chart into one smoother line. Once it is on your chart, you can ask it two plain questions: where is price compared with the line, and which way is the line pointing?
Neither answer predicts the next move. Together they give a quick, rule-based description of what price has done over the window the average covers.
Is price above or below the average?
Say EUR/USD closes at 1.1060 and its 5-day simple moving average is 1.1032. Price sits 28 pips above the line, so the latest close is higher than the average close of the last five days.
That is the first reading. A close above the average means price is higher than where it has been, on average, during the window. A close below means it is lower.
One close on the other side is weak evidence. Price can poke through the line for a single bar and come straight back, so a run of closes on one side says more than one.
Judge by closing prices, because a moving average is normally built from them. The latest point on the line keeps moving until its bar closes, so a wick through the line proves little.
Which way is the line sloping?
The second reading is the direction of the average itself, its slope: how much the line rises or falls from one bar to the next. A rising line means the average close is climbing. A falling line means it is dropping.
Avoid judging slope by the angle on your screen. Zoom in or squeeze the chart and the same line looks steep or flat. Measure it instead: compare the average now with its value a fixed number of bars ago.
Suppose a 50-day average reads 1.0950 today and read 1.0900 ten days ago. The rise is 0.0050, or 50 pips, over 10 bars, which is 5 pips per day. These numbers are illustrative.
A slope in pips per bar only compares like with like. Five pips a day is a lot on a quiet pair and little on a volatile one, so compare a pair with its own history.
A worked example with a 5-day average
A 5-day average is short, but it lets you redo every step by hand. Here are seven illustrative daily closes for EUR/USD: 1.1000, 1.1010, 1.1030, 1.1020, 1.1040, 1.1060 and 1.1010.
- Day 5 average: add days 1 to 5. 1.1000 + 1.1010 + 1.1030 + 1.1020 + 1.1040 = 5.5100, and 5.5100 ÷ 5 = 1.1020.
- Day 5 reading: the close of 1.1040 is 20 pips above 1.1020.
- Day 6 average: the window drops day 1 and adds day 6. 5.5100 − 1.1000 + 1.1060 = 5.5160, and 5.5160 ÷ 5 = 1.1032.
- Day 6 reading: the slope is 1.1032 − 1.1020 = 0.0012, a rise of 12 pips, and the close of 1.1060 is 28 pips above. Both readings point up.
- Day 7 average: the window drops day 2 (1.1010) and adds day 7 (1.1010). The sum stays 5.5160, so the average stays 1.1032 and the slope is zero.
- Day 7 reading: the close of 1.1010 is 22 pips below 1.1032. Price says down while the line is flat, so the picture is mixed.
| Day | Close | 5-day SMA | Change in SMA | Close vs SMA |
|---|---|---|---|---|
| 5 | 1.1040 | 1.1020 | n/a | 20 pips above |
| 6 | 1.1060 | 1.1032 | +12 pips | 28 pips above |
| 7 | 1.1010 | 1.1032 | 0 pips | 22 pips below |
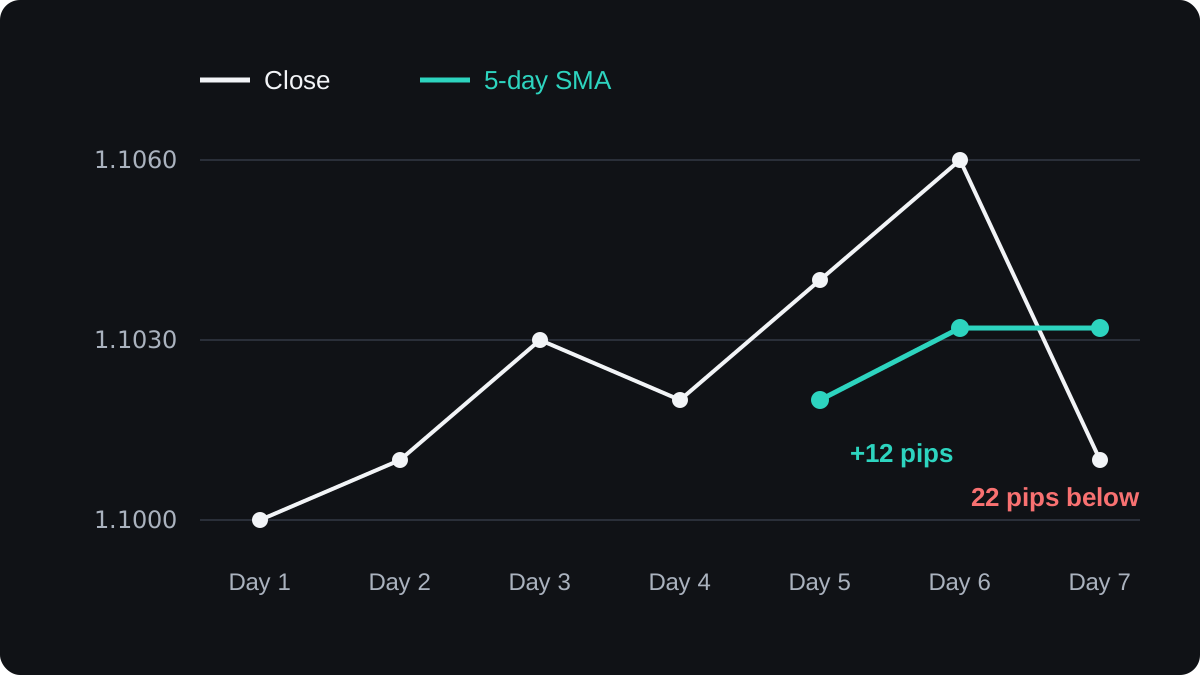
Step 3 uses a shortcut that works for any simple moving average. The line changes each bar by the new close minus the close leaving the window, divided by the period: (1.1060 − 1.1000) ÷ 5 = 0.0012.
This is also why an average lags. On day 7 price fell 50 pips from 1.1060 to 1.1010, yet the line did not move, because the close that left the window matched the one that arrived.
Putting the two readings together
Each reading on its own is weak. Read them together and you get four cases.
Price above a rising average is the standard uptrend reading. Price below a falling average is the downtrend reading.
When the two disagree, the trend may be pausing or turning, or there may be no trend at all. The average cannot tell you which.
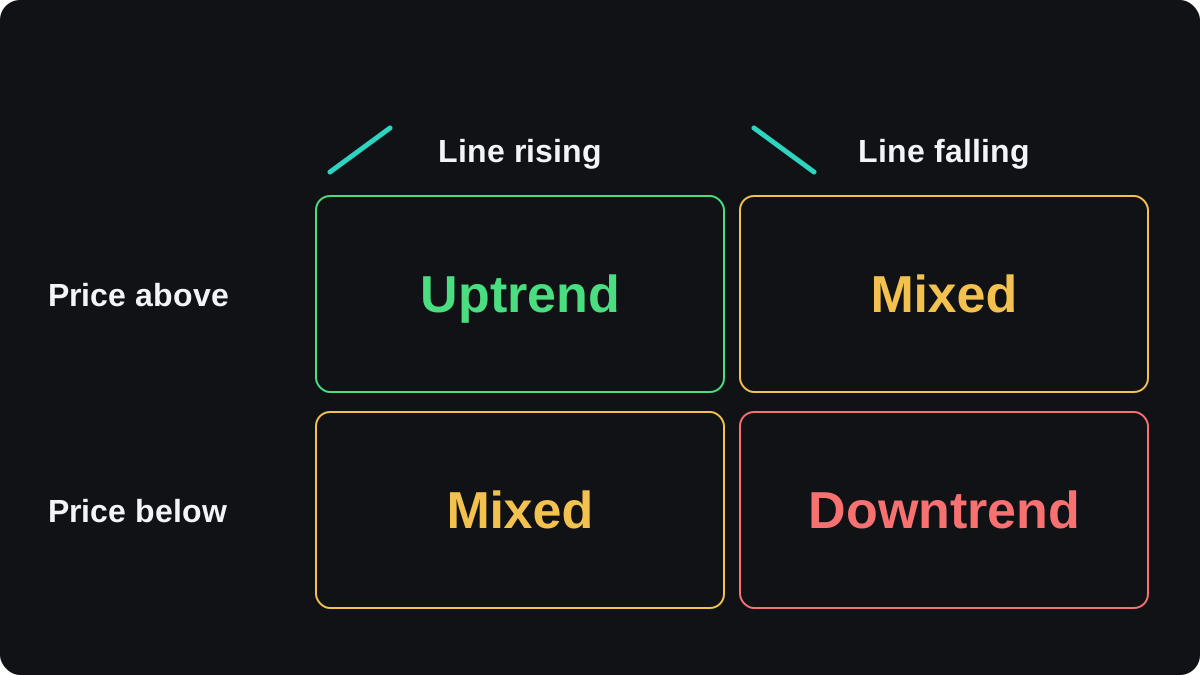
A flat line, like the one on day 7, gives no slope reading at all, so that case counts as mixed too.
A mixed reading often appears first when a trend turns, because price reacts at once and the average follows later. On day 7, price had already dropped below a line that had not yet turned down.
One common use is as a filter: look only for buy setups in an uptrend reading and only for sell setups in a downtrend reading. That is one possible approach, and it still needs its own entry and exit rules.
How the period and timeframe change the answer
A short average follows price closely and changes direction often. A long one moves slowly and ignores small swings. On the same daily chart, a 20-day line can be falling while a 200-day line is still rising.
Both describe their own window correctly. The 20-day line covers about four weeks of trading, and the 200-day line covers most of a year.
Periods such as 20, 50 and 200 are widely used. Nothing in the maths makes them better than 30 or 100.
Timeframe works the same way. A 50-period average on a 1-hour chart covers about two days, while on a daily chart it covers about ten weeks.
Reading a higher timeframe first, then a lower one, is the idea behind using more than one timeframe.
An exponential average turns sooner than a simple one of the same period because it weights recent closes more, as the SMA or EMA lesson showed. Both readings work the same way on either line.
Where trend reading fails
In a range, price swings back and forth across a flat average. Each cross can look like the start of a trend, and none of them lasts.
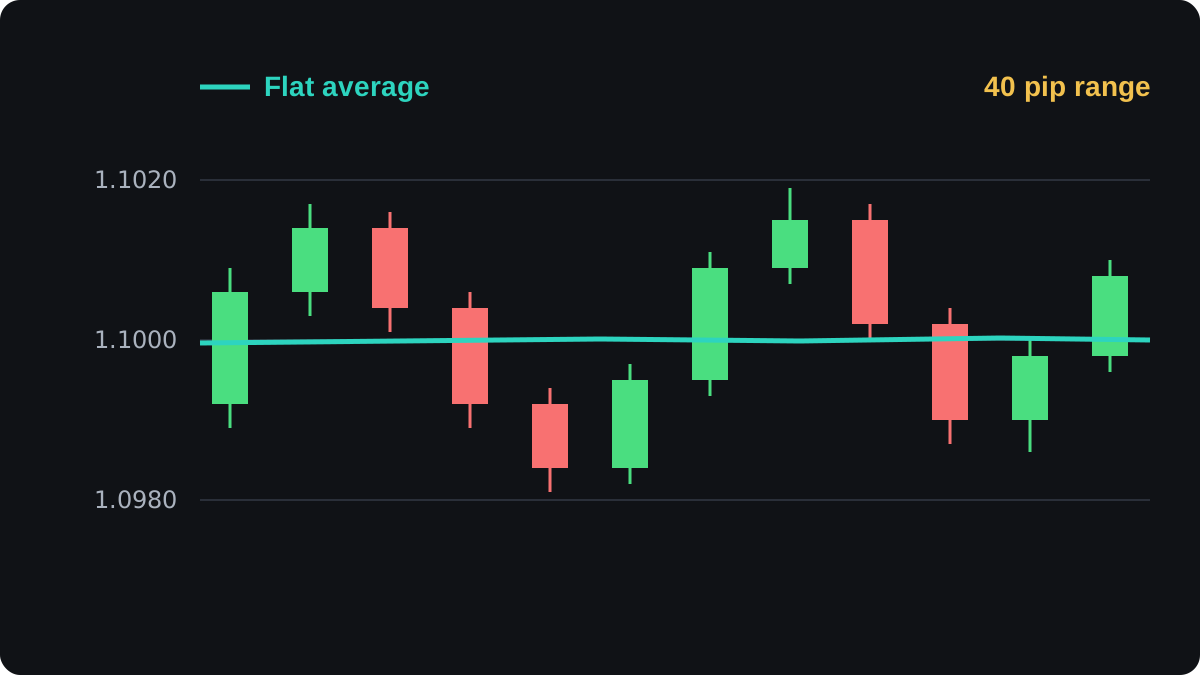
In that chart, price stays between 1.0980 and 1.1020, a 40 pip range, and the closes cross the line four times. None of those crosses starts a trend.
The flat slope is the warning: when the line barely moves, the above or below reading means little. The lesson on trending versus ranging markets covers how to tell the two apart.
Lag is the other cost. An average is built from past closes, so it confirms a trend after part of the move has happened, and confirms the end after part of the reversal has happened.
A sudden move on news can carry price far from the average in one bar. The line then catches up over the next bars, which can make the slope look steepest just as the move is ending.
The evidence that simple trend rules make money in currency markets is mixed, and rules that look good on past charts often do worse later. Test any rule you build on these readings with a backtest before relying on it.
Two averages of different periods crossing each other is the next tool in this module, covered in moving average crossovers.
Câu hỏi thường gặp
Does price above the 200-day moving average mean an uptrend?
It means price is higher than its average close over roughly the last 200 trading days. Check the slope too, because price above a falling 200-day line is a mixed reading.
How do you measure the slope of a moving average?
Subtract the average's value a fixed number of bars ago from its value now, then divide by that number of bars. A figure in pips per bar is more reliable than the angle on screen, which changes with chart zoom.
Which moving average period is best for trend direction?
No single period is best. Shorter averages react sooner and give more false turns, longer ones react later and give fewer, so match the period to how long you expect to hold a trade.
Why does price keep crossing the moving average?
Usually because the market is ranging. When the line is flat, price crosses it back and forth without starting a trend.
Học tiếp
 Chương 4What is a moving average?A moving average is the average closing price over a set number of recent candles, recalculated every time a new candle closes. Plotted as a line, it smooths out small price swings so the direction of the trend is easier to see. Because it is built from past prices, it always lags behind the market.
 Chương 4Simple moving average (SMA).A simple moving average (SMA) adds the closing prices of the last N candles and divides by N. Each new candle adds one price and drops the oldest, so the line rolls forward. Every price carries equal weight, so one unusually large close lifts the average and moves it again when it drops out.
 Chương 4Exponential moving average (EMA).An exponential moving average (EMA) is an average of past prices that gives the latest close the most weight. Each period it moves part of the way toward the new price, by a share set by k = 2 ÷ (N + 1). It turns sooner than a simple moving average, but it still lags and gives false signals in sideways markets.
 Chương 4SMA or EMA: which should you use?An SMA gives every price in its window the same weight, so it is smooth but slow to turn. An EMA gives the newest prices more weight, so it turns sooner but reacts more to noise. Neither is better in general: choose by the job and test it on your own charts.
 Chương 4Moving average crossovers.A moving average crossover is the moment a fast moving average crosses a slow one. A cross above is read as a buy signal and a cross below as a sell signal. Because both lines are built from past prices, the signal always comes after the turn, and sideways markets produce repeated false crosses.
 Chương 4Moving averages as dynamic support and resistance.Dynamic support is a moving average that sits below price in an uptrend and keeps rising with it, so pullbacks sometimes pause near the line. Dynamic resistance is the same idea above price in a downtrend. Treat the line as a rough zone. It is most useful in clear trends and often fails in ranges.
 Chương 4Moving averages cheat sheet.A moving average is the average of recent closing prices, recalculated on every new bar. The SMA weights the last N closes equally, and the EMA weights recent closes more, so it reacts faster. Traders use the slope for trend, fast and slow crossovers as signals and the line as moving support or resistance, and every version lags price.

