What is a moving average?
A moving average is the average closing price over a set number of recent candles, recalculated every time a new candle closes. Plotted as a line, it smooths out small price swings so the direction of the trend is easier to see. Because it is built from past prices, it always lags behind the market.
Nội dung này hiện chỉ có bản tiếng Anh.

Open any chart and the price never moves in a straight line. Even during a clear rise, candles jump up and down from one hour to the next.
A moving average draws one calmer line through that movement, so the direction underneath is easier to see.
It is among the simplest indicators on any platform, and the rest of this module builds on the idea in this lesson.
How is a moving average calculated?
Take the last five daily closing prices of EUR/USD, add them up and divide by five. The result is the average close over those five days. Here are seven days of round illustrative closes:
| Day | Close |
|---|---|
| 1 | 1.10000 |
| 2 | 1.10200 |
| 3 | 1.10100 |
| 4 | 1.10400 |
| 5 | 1.10300 |
| 6 | 1.10600 |
| 7 | 1.10500 |
Work out the average on day 5, then move it forward one day at a time:
- On day 5, add the closes for days 1 to 5: 1.10000 + 1.10200 + 1.10100 + 1.10400 + 1.10300 = 5.51000.
- Divide by five: 5.51000 ÷ 5 = 1.10200. This is the first point of the line.
- On day 6, drop day 1 and add day 6: 5.51000 minus 1.10000 plus 1.10600 = 5.51600.
- Divide by five: 5.51600 ÷ 5 = 1.10320.
- On day 7, drop day 2 and add day 7: 5.51600 minus 1.10200 plus 1.10500 = 5.51900, and 5.51900 ÷ 5 = 1.10380.
The group of five candles slides forward by one each time a new candle closes. That sliding is why the average is called moving.
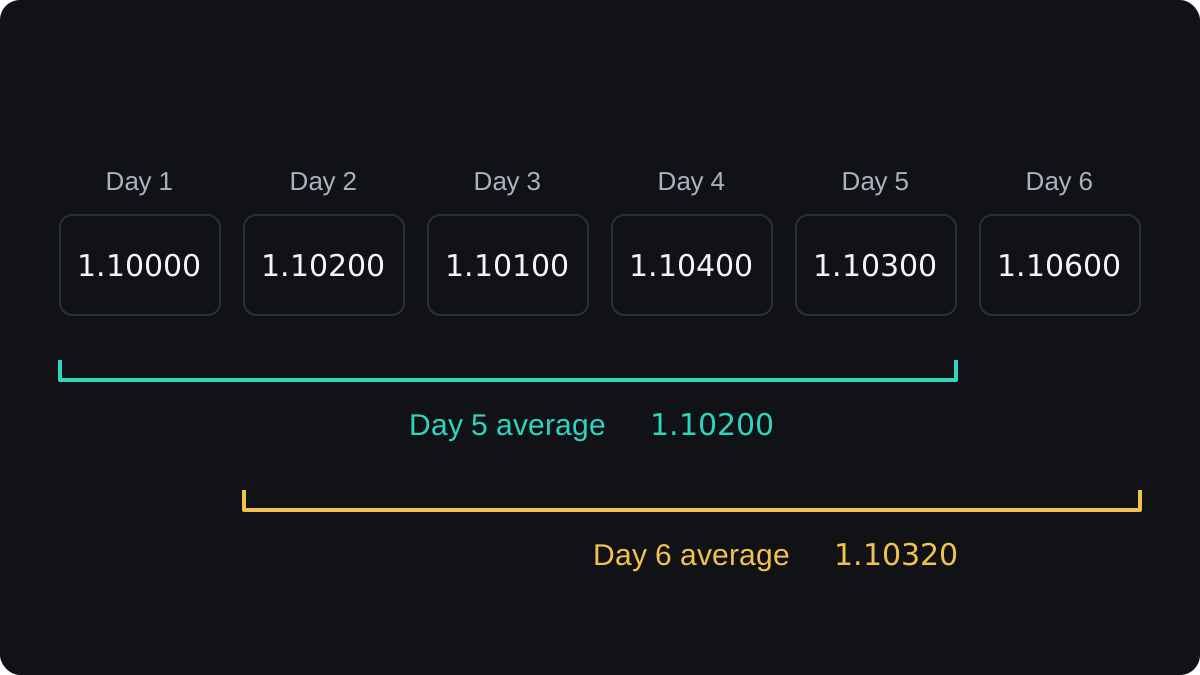
A moving average is the average price over a fixed number of recent candles, recalculated each time a new candle closes. That number of candles is the period, so the example above is a 5-period moving average.
Join the daily values and you get a line drawn on the chart alongside the price. Your platform does this arithmetic for you, though doing it once by hand shows exactly what the line contains.
Why does a smoother line help?
In the first five days the closes zigzag: up 20 pips, down 10, up 30, down 10. Any single day on its own tells you little about the direction.
Carry the example on for another week, using the same drop-one, add-one method each day:
| Day | Close | 5-period average |
|---|---|---|
| 5 | 1.10300 | 1.10200 |
| 6 | 1.10600 | 1.10320 |
| 7 | 1.10500 | 1.10380 |
| 8 | 1.10800 | 1.10520 |
| 9 | 1.10600 | 1.10560 |
| 10 | 1.10700 | 1.10640 |
| 11 | 1.10400 | 1.10600 |
| 12 | 1.10500 | 1.10600 |
| 13 | 1.10200 | 1.10480 |
| 14 | 1.10300 | 1.10420 |
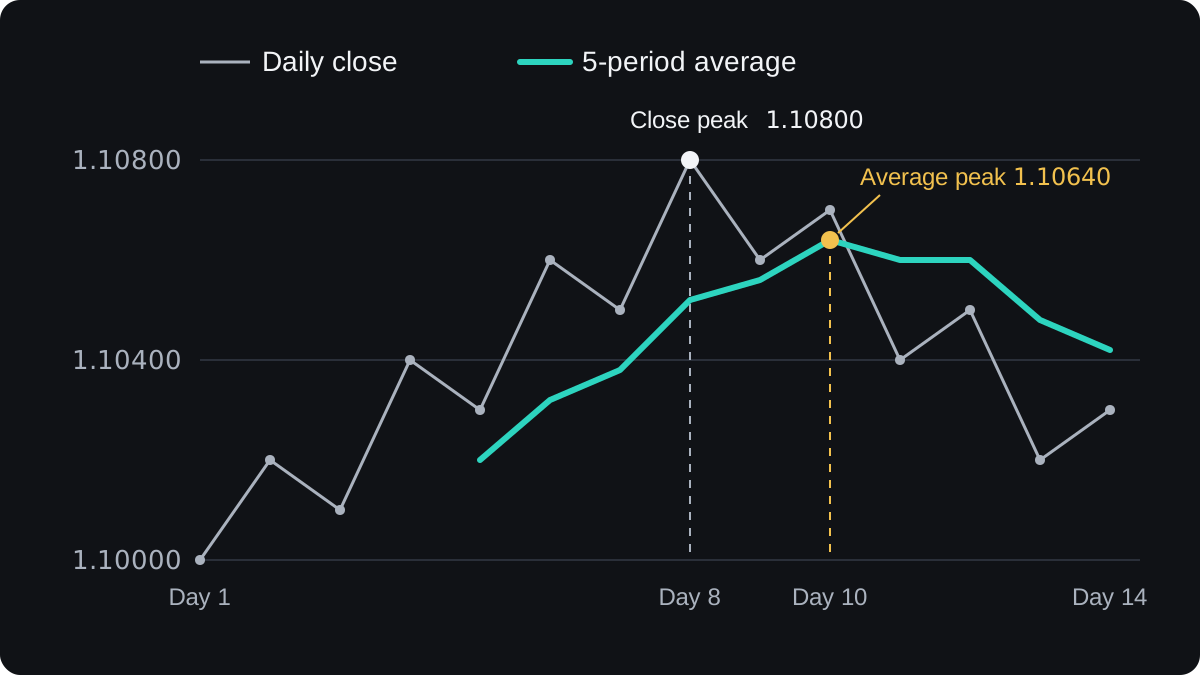
The closes keep jumping up and down. The average climbs every day from day 5 to day 10, holds flat for two days, then turns lower and ends at 1.10420 on day 14.
Those small back-and-forth moves are often called noise. The average filters much of it out, so you can judge the direction without reacting to every candle.
An average always sits between the highest and lowest close in its window, so the line cuts off the extremes. Here the closes peak at 1.10800 on day 8, while the average peaks lower, at 1.10640 on day 10.
What does the period setting change?
A period counts candles, so its time span depends on the chart you use. A 20-period average covers 20 hours on a one-hour chart and 20 trading days on a daily chart.
A short period follows price closely and turns quickly. A long period moves slowly, because each new candle is a small part of the total: one tenth of a 10-period simple average, and one two-hundredth of a 200-period one.
| Period | Candles in each average | Typical behaviour |
|---|---|---|
| 10 | 10 | Stays close to price and turns quickly |
| 50 | 50 | Smoother, turns later |
| 200 | 200 | Very smooth, turns slowest |
Popular settings include 20, 50 and 200 periods. They are conventions, and no period is right for every pair or timeframe.
Charts often show a short and a long average together. The crossover lesson covers what traders read when the two lines meet.
Where do moving averages fall short?
They lag behind price
A moving average is built entirely from past closes, so it always runs behind. A 5-period average is centred on the middle of its window, two candles before the latest close.
You can see this in the example. The closes topped on day 8, yet the average kept rising until day 10 and first fell on day 11.
A longer period gives a smoother line and a larger delay. A 21-period average is centred ten candles back, so less noise comes with more lag.
They mislead in sideways markets
When price moves sideways, the average flattens and price keeps crossing it. Each cross can look like a fresh signal, yet in a range it often reverses a candle or two later.
Take closes that repeat 1.10000, 1.10400, 1.10100, 1.10500 for 12 days. The 5-period average stays between 1.10200 and 1.10300, and from day 5 to day 12 the close crosses it seven times.
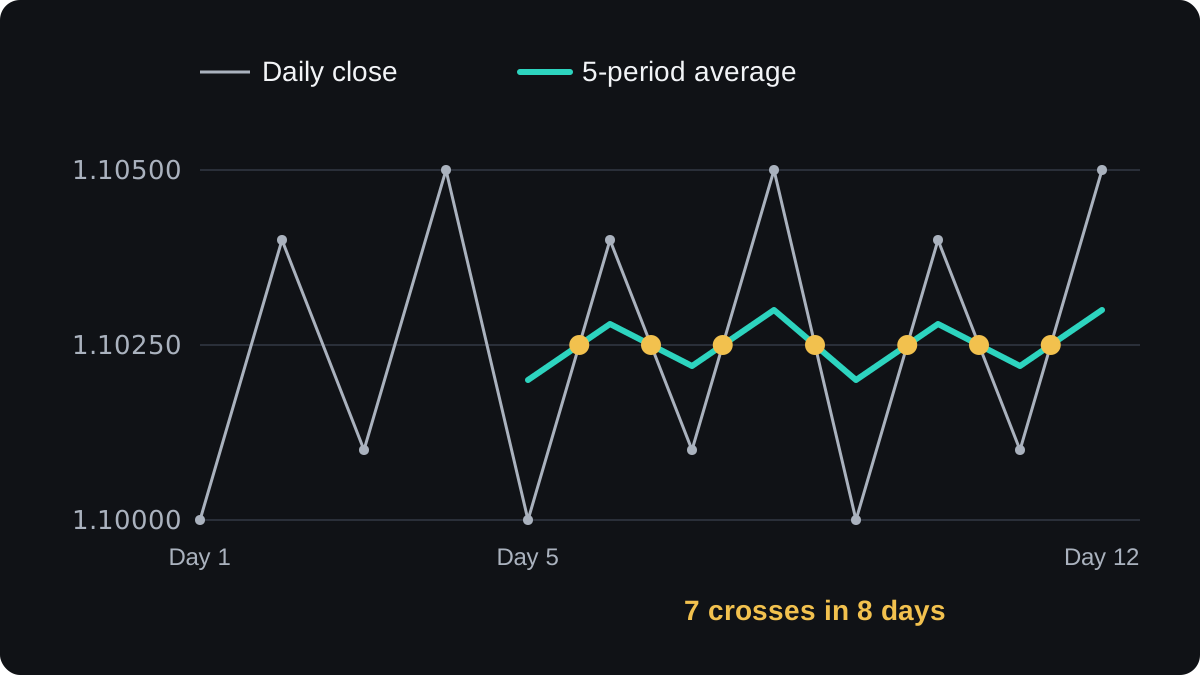
Traders call these false signals whipsaws. The lesson on trending versus ranging markets looks at ways to tell the two conditions apart.
They do not forecast
A moving average summarises what price has already done. It cannot tell you what the next candle will do, and studies of simple moving average trading rules have produced mixed results, particularly once trading costs are counted.
Which price and which type of average?
Platforms usually average the closing price unless you choose otherwise. MetaTrader, for example, also lets you average the open, the high, the low or a blend of them.
The method matters as well. The simple moving average (SMA) used in this lesson gives every candle in the window equal weight. The SMA lesson works through it in more detail.
An exponential moving average (EMA) gives more weight to recent candles, so it responds faster to new prices and lags a little less. The EMA lesson shows how that weighting works.
MetaTrader also offers smoothed and linear weighted versions. Later in this module you will use the line to judge trend direction and as moving support and resistance.
Câu hỏi thường gặp
What is a moving average in simple terms?
It is the average price of the last few candles, worked out again every time a new candle closes. Plotted on the chart, it gives a smoother line than the price itself.
What is the best moving average period?
No period is best for every market. Short periods such as 10 or 20 react quickly but give more false turns, while long periods such as 200 are smoother but slower.
Why does a moving average lag behind price?
It is built only from past prices. A simple average of N candles is centred (N minus 1) ÷ 2 candles back, so a 5-period average sits two candles behind the latest close.
Can a moving average predict where price will go?
No. It summarises past prices, and the evidence that simple moving average rules make money after costs is mixed.
What is the difference between an SMA and an EMA?
An SMA gives every candle in the period the same weight. An EMA gives recent candles more weight, so it turns sooner after price changes direction.
Học tiếp
 Chương 4Simple moving average (SMA).A simple moving average (SMA) adds the closing prices of the last N candles and divides by N. Each new candle adds one price and drops the oldest, so the line rolls forward. Every price carries equal weight, so one unusually large close lifts the average and moves it again when it drops out.
 Chương 4Exponential moving average (EMA).An exponential moving average (EMA) is an average of past prices that gives the latest close the most weight. Each period it moves part of the way toward the new price, by a share set by k = 2 ÷ (N + 1). It turns sooner than a simple moving average, but it still lags and gives false signals in sideways markets.
 Chương 4SMA or EMA: which should you use?An SMA gives every price in its window the same weight, so it is smooth but slow to turn. An EMA gives the newest prices more weight, so it turns sooner but reacts more to noise. Neither is better in general: choose by the job and test it on your own charts.
 Chương 4Using moving averages to read the trend.A moving average gives two trend readings. Price above the line means the latest close is higher than the average, and price below means lower. The line's slope shows whether the average itself is rising or falling. When both point the same way, the trend reading is clear; when they disagree, it is mixed.
 Chương 4Moving average crossovers.A moving average crossover is the moment a fast moving average crosses a slow one. A cross above is read as a buy signal and a cross below as a sell signal. Because both lines are built from past prices, the signal always comes after the turn, and sideways markets produce repeated false crosses.
 Chương 4Moving averages as dynamic support and resistance.Dynamic support is a moving average that sits below price in an uptrend and keeps rising with it, so pullbacks sometimes pause near the line. Dynamic resistance is the same idea above price in a downtrend. Treat the line as a rough zone. It is most useful in clear trends and often fails in ranges.
 Chương 4Moving averages cheat sheet.A moving average is the average of recent closing prices, recalculated on every new bar. The SMA weights the last N closes equally, and the EMA weights recent closes more, so it reacts faster. Traders use the slope for trend, fast and slow crossovers as signals and the line as moving support or resistance, and every version lags price.

