Moving average crossovers.
A moving average crossover is the moment a fast moving average crosses a slow one. A cross above is read as a buy signal and a cross below as a sell signal. Because both lines are built from past prices, the signal always comes after the turn, and sideways markets produce repeated false crosses.
Nội dung này hiện chỉ có bản tiếng Anh.

Put two moving averages on the same chart, one short and one long, and sooner or later they cross.
Traders read that moment as a change in direction: the short line moving above the long one is a buy signal, and moving below it is a sell signal.
The idea is simple to test and easy to automate. Its weakness is built in: both lines are made from past prices, so the cross always arrives after the turn it is meant to catch.
What is a moving average crossover?
A moving average crossover is the point where a faster moving average crosses a slower one. The fast line averages fewer periods, so it follows price closely. The slow line averages more periods, so it moves more calmly.
When the fast line crosses above the slow line, the latest prices are higher on average than the longer window. This is called a bullish crossover. When the fast line crosses below, it is a bearish crossover.
A simpler version uses one average and the price itself, with a close above the average as the signal. The two-line version reacts more slowly, and that trade-off runs through this whole lesson.
The previous lesson used moving averages to read the trend. A crossover turns that reading into a rule with a definite moment to enter.
Which averages do traders pair?
Any two periods can be paired, as long as one is shorter than the other. Some pairs come up often enough to have names.
| Pair | Where you often see it |
|---|---|
| 50-day and 200-day SMA | Daily charts. A cross up is called a golden cross, a cross down a death cross |
| 20 and 50 period | Daily and 4-hour charts |
| 9 and 21 period EMA | Intraday charts |
| 12 and 26 period EMA | Inside the MACD indicator |
You can build a crossover from a simple moving average or an exponential moving average. With the same periods, an EMA weights recent prices more, so EMA crossovers tend to come a little sooner and to flip more often.
The periods themselves carry no special power. 50 and 200 are round numbers that became a convention, and no pair of periods is known to be best for every market.
A crossover worked through, day by day
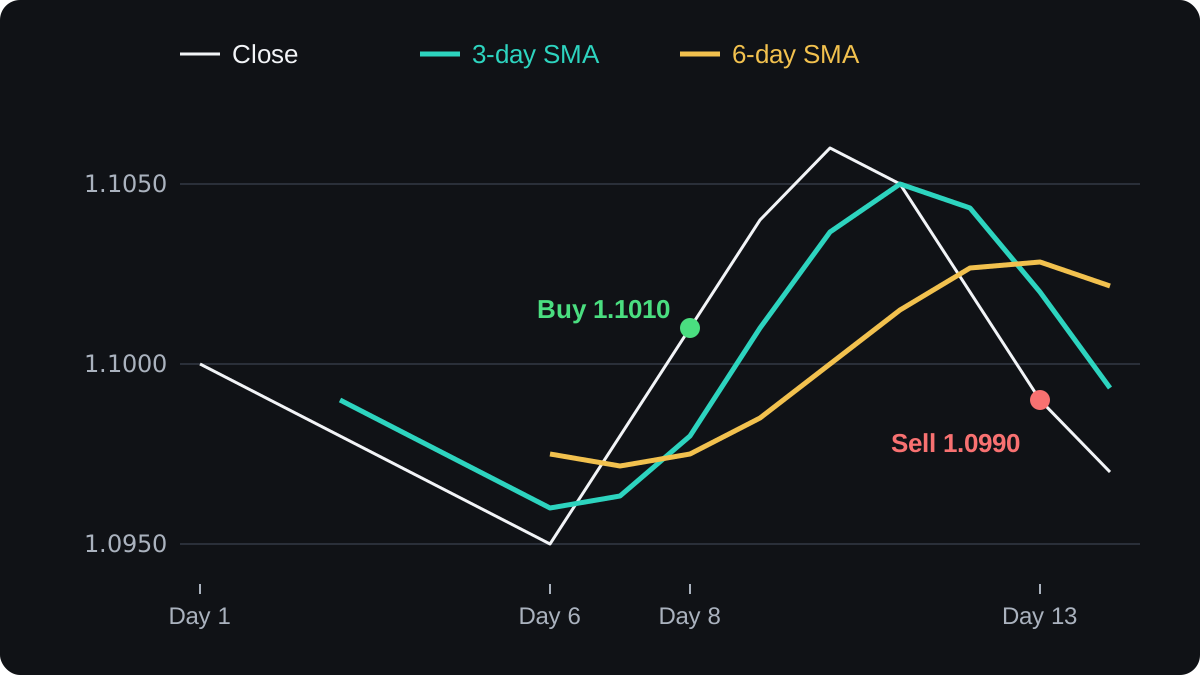
Here are 14 daily closes on EUR/USD. They are illustrative numbers chosen to keep the maths easy.
The fast line is a 3-day SMA and the slow line is a 6-day SMA. The mechanism is the same for 50 and 200.
Each average is the sum of the last N closes divided by N. On day 8, the 3-day SMA is (1.0950 + 1.0980 + 1.1010) ÷ 3 = 1.0980.
The 6-day SMA on day 8 adds the closes of days 3 to 8, which sum to 6.5850, and divides by 6 to get 1.0975.
| Day | Close | 3-day SMA | 6-day SMA | Fast vs slow |
|---|---|---|---|---|
| 1 | 1.1000 | |||
| 2 | 1.0990 | |||
| 3 | 1.0980 | 1.09900 | ||
| 4 | 1.0970 | 1.09800 | ||
| 5 | 1.0960 | 1.09700 | ||
| 6 | 1.0950 | 1.09600 | 1.09750 | Below |
| 7 | 1.0980 | 1.09633 | 1.09717 | Below |
| 8 | 1.1010 | 1.09800 | 1.09750 | Above (cross up) |
| 9 | 1.1040 | 1.10100 | 1.09850 | Above |
| 10 | 1.1060 | 1.10367 | 1.10000 | Above |
| 11 | 1.1050 | 1.10500 | 1.10150 | Above |
| 12 | 1.1020 | 1.10433 | 1.10267 | Above |
| 13 | 1.0990 | 1.10200 | 1.10283 | Below (cross down) |
| 14 | 1.0970 | 1.09933 | 1.10217 | Below |
Now apply a plain crossover rule to the table, using closing prices and ignoring the spread:
- On day 7 the fast line, 1.09633, is still below the slow line, 1.09717. No signal.
- On day 8 the fast line, 1.09800, is above the slow line, 1.09750. The lines have crossed, so the rule buys at the day 8 close of 1.1010.
- On day 13 the fast line, 1.10200, drops below the slow line, 1.10283. The rule sells at the close of 1.0990.
- The result is 1.0990 minus 1.1010, which is minus 0.0020, a loss of 20 pips.
- On 0.10 lot of EUR/USD a pip is worth 10,000 × 0.0001 = $1, so the loss is $20 before the spread.
Why the crossover signal always lags
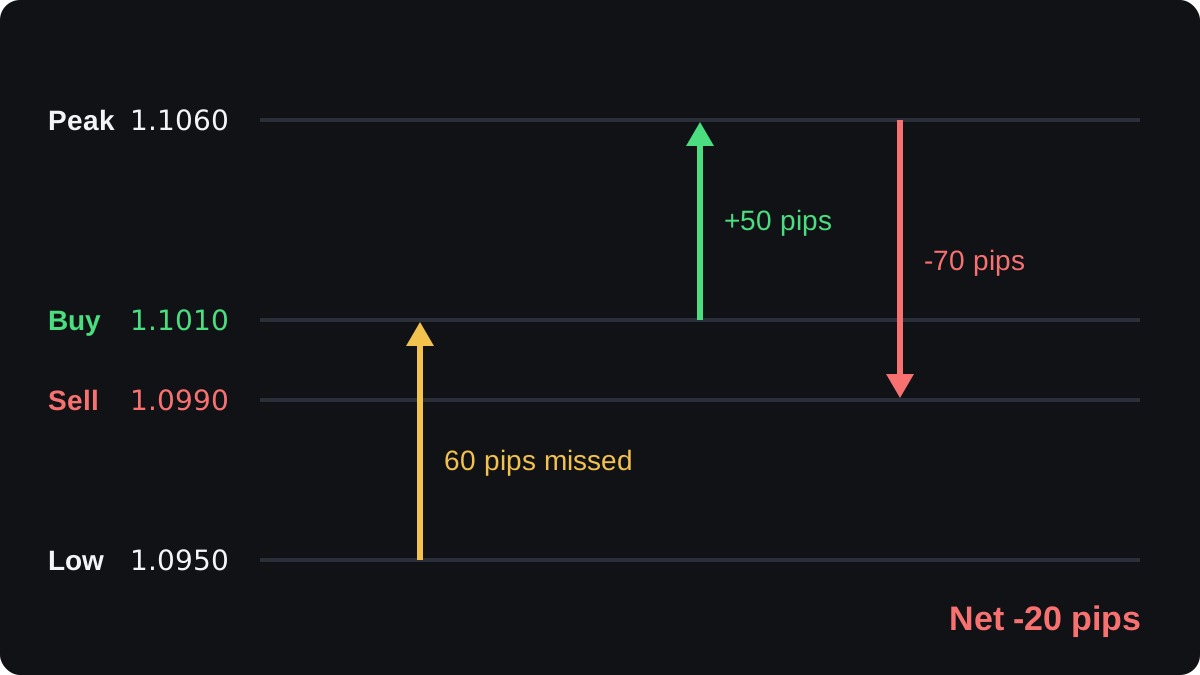
Look at where the trade sat inside the move. The lowest close was 1.0950 on day 6 and the highest was 1.1060 on day 10, a swing of 110 pips.
The buy came at 1.1010, 60 pips above the low. Price rose another 50 pips to 1.1060, then fell 70 pips to the exit at 1.0990. The rule caught none of the 110 pip swing and finished 20 pips down.
The cause is arithmetic: an N-period SMA averages the latest close and the N - 1 closes before it, so its centre sits (N - 1) ÷ 2 periods in the past.
The 3-day line therefore lags by about 1 day and the 6-day line by about 2.5 days.
For a cross to happen, price has to move far enough to drag the fast average past the slow one, and by then part of the move is already spent.
Longer pairs lag more. On a daily chart the 200-day SMA is centred about 100 trading days back, so a golden cross can confirm a rise that began months earlier.
Shorter periods cut the lag but cross more often on random noise. Longer periods filter the noise but enter and exit later. Changing the settings moves you along that trade-off and never removes it.
Where crossovers fail: sideways markets
The worked example was a short trend that reversed. In a market moving sideways, the two averages twist around each other and produce cross after cross, and each one can be a small loss plus the spread.
These repeated false signals are called whipsaws. A crossover rule cannot know in advance whether the market will trend or range, so it takes every signal and relies on an occasional long trend to pay for the small losses.
By construction, then, crossovers tend to look good on charts with long, smooth trends and poor on choppy ones. Results also shift with the pair, the periods, the timeframe and your trading costs.
Treat any claim that a particular pair of periods works as unproven until you have checked it yourself. The lesson on how to backtest a strategy shows how to run that test honestly, with costs included.
Ways traders try to filter crossover signals
Filters aim to skip some of the whipsaws. Each one also delays or drops some good signals, so every filter has a cost.
- Wait for the candle to close with the lines crossed, so a cross that reverses inside the bar does not count.
- Trade only in the direction of a third, slower average, for example taking a 20 and 50 buy signal only when price is above the 200.
- Require the slow average to slope in the direction of the signal.
- Check a trend-strength reading such as the ADX and ignore crosses when it is low.
- Require a minimum gap between the two lines, in pips, before treating the cross as real.
Exits are a separate decision. The worked example used the opposite cross to exit, which gave back 70 pips from the high. A rule can instead set a stop loss at entry and use the cross only to get in.
The MACD line is the gap between a 12 and a 26 period EMA, so its crossing zero is the same event as that EMA crossover.
Averages also act on price as levels, which is the subject of moving averages as dynamic support and resistance.
Câu hỏi thường gặp
What is a golden cross?
A golden cross is when the 50-day moving average crosses above the 200-day moving average. The opposite, the 50-day crossing below the 200-day, is called a death cross. Both are slow, lagging signals that confirm a move already well under way.
Which moving average crossover is best?
No pair of periods is best for every market. Shorter pairs signal earlier but give more false signals, and longer pairs give fewer signals that arrive later. Test any pair on the instrument and timeframe you trade, with costs included.
Is an EMA crossover better than an SMA crossover?
An EMA crossover usually comes a little earlier because recent prices carry more weight. It also flips more often in choppy markets, so the earlier signal comes with more whipsaws.
Why did my crossover trade lose money when the trend did change?
The entry cross arrives after the turn, and the exit cross arrives after the next turn.
In this lesson's example a 110 pip swing still produced a 20 pip loss, because the rule bought 60 pips above the low and sold 70 pips below the high.
Do crossovers work on any timeframe?
The arithmetic is the same on a 5-minute chart as on a daily chart. Lower timeframes produce more crosses, so spreads and false signals take a bigger share of each result.
Học tiếp
 Chương 4What is a moving average?A moving average is the average closing price over a set number of recent candles, recalculated every time a new candle closes. Plotted as a line, it smooths out small price swings so the direction of the trend is easier to see. Because it is built from past prices, it always lags behind the market.
 Chương 4Simple moving average (SMA).A simple moving average (SMA) adds the closing prices of the last N candles and divides by N. Each new candle adds one price and drops the oldest, so the line rolls forward. Every price carries equal weight, so one unusually large close lifts the average and moves it again when it drops out.
 Chương 4Exponential moving average (EMA).An exponential moving average (EMA) is an average of past prices that gives the latest close the most weight. Each period it moves part of the way toward the new price, by a share set by k = 2 ÷ (N + 1). It turns sooner than a simple moving average, but it still lags and gives false signals in sideways markets.
 Chương 4SMA or EMA: which should you use?An SMA gives every price in its window the same weight, so it is smooth but slow to turn. An EMA gives the newest prices more weight, so it turns sooner but reacts more to noise. Neither is better in general: choose by the job and test it on your own charts.
 Chương 4Using moving averages to read the trend.A moving average gives two trend readings. Price above the line means the latest close is higher than the average, and price below means lower. The line's slope shows whether the average itself is rising or falling. When both point the same way, the trend reading is clear; when they disagree, it is mixed.
 Chương 4Moving averages as dynamic support and resistance.Dynamic support is a moving average that sits below price in an uptrend and keeps rising with it, so pullbacks sometimes pause near the line. Dynamic resistance is the same idea above price in a downtrend. Treat the line as a rough zone. It is most useful in clear trends and often fails in ranges.
 Chương 4Moving averages cheat sheet.A moving average is the average of recent closing prices, recalculated on every new bar. The SMA weights the last N closes equally, and the EMA weights recent closes more, so it reacts faster. Traders use the slope for trend, fast and slow crossovers as signals and the line as moving support or resistance, and every version lags price.

