Spotting a narrative shift.
A narrative shift is when the market starts reading the same news through a new question, such as rate cuts instead of rate hikes. Signs include smaller or reversed reactions to familiar data, swings in rate expectations, a fading link to the old driver and a break in price structure, though none is reliable on its own.
Nội dung này hiện chỉ có bản tiếng Anh.

For months, every strong US jobs report lifts the dollar. Then a report just as strong comes out and the dollar barely moves, or even falls. The data has not changed much, so what changed is the question the market uses to read it.
The previous lesson explained what a market narrative is. This one covers the signs that a new narrative is taking over, and why those signs are easier to read afterwards than in real time.
What changes when a narrative shifts?
A narrative is the main question traders are asking about a currency. For a long stretch it might be how high a central bank will raise rates. Later it might be how soon the bank will cut them.
When the question changes, the same data is read differently. In a rate hike story, a strong jobs report means more hikes and a firmer currency.
In a slowdown story, the same report may count for little, because traders now care more about weakness elsewhere.
A shift rarely comes with an announcement. It shows up first in behaviour you can measure, such as how far price moves after the same kind of news.
Does the same news still move price the same way?
Reaction to news is the cleanest test. Pick one regular release, compare the result with the forecast, and note how far the pair moves in the first hour. Release times and forecasts are on the economic calendar.
The size of the surprise matters more than the number itself, as the expectations versus actual lesson explains. So compare reactions only to surprises of a similar size.
Here is an illustrative run of four monthly US jobs reports. Each beats its forecast by about the same margin. In the old story, each should lift the dollar and push EUR/USD down.
| Report | Price before | One hour later | Move |
|---|---|---|---|
| Month 1 | 1.10200 | 1.09800 | -40 pips |
| Month 2 | 1.09600 | 1.09250 | -35 pips |
| Month 3 | 1.09300 | 1.09200 | -10 pips |
| Month 4 | 1.09100 | 1.09250 | +15 pips |
You can check each row. A pip on EUR/USD is 0.0001.
- Month 1: 1.10200 minus 1.09800 = 0.00400, a fall of 40 pips.
- Month 2: 1.09600 minus 1.09250 = 0.00350, a fall of 35 pips.
- Month 3: 1.09300 minus 1.09200 = 0.00100, a fall of 10 pips.
- Month 4: 1.09250 minus 1.09100 = 0.00150, a rise of 15 pips, against the old story.
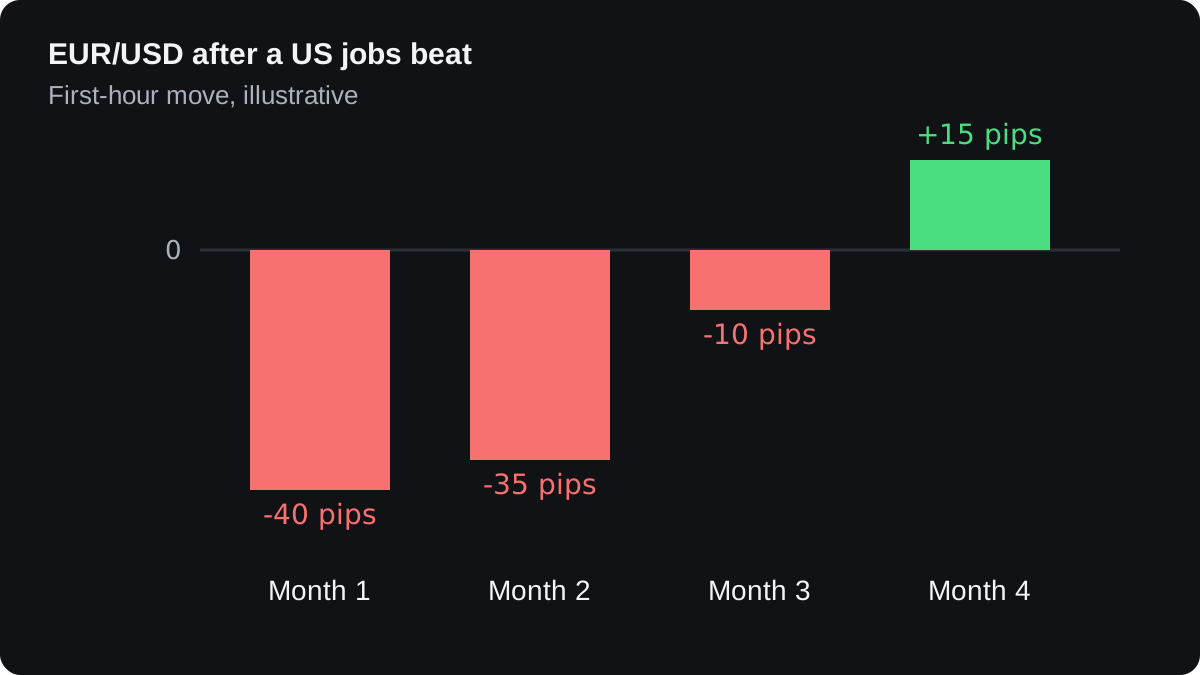
Shrinking reactions suggest the old story is losing force. A move in the wrong direction after a clear surprise is a stronger sign, because it suggests traders are reading good US data through a different question.
Trading on the old reaction would have cost money here. Say you sell 0.10 lot of EUR/USD at 1.09100 just before the fourth report. On 0.10 lot, 10,000 euros, one pip is worth 10,000 × 0.0001 = $1.
The pair ends the hour at 1.09250, so the trade is 15 pips down. That is 15 × $1 = $15 lost before spread and commission.
One odd reaction proves little. Other news in the same hour, thin trading or traders closing old positions can bend a single move, so look for a pattern across several releases.
Are rate expectations and old correlations moving?
Currencies often follow what traders expect central banks to do next, as the interest rates lesson explains. Those expectations show up in short-term government bond yields and interest rate futures, and they can turn before the currency does.
Take round illustrative numbers. A central bank rate is 4.00%, and futures imply 4.50% in a year, so the market prices 0.50 percentage point of hikes. After weak data and a softer speech, the implied rate drops to 3.75%.
Pricing has gone from 0.50 point of hikes to 0.25 point of cuts, a swing of 0.75 point. With a common step size of 0.25 point, that equals three rate moves' worth of change in expectations.
Central bank wording matters too. When a bank drops a phrase it has used for months, or its governor starts talking about growth risks instead of inflation, traders often take it as a hint that the question has changed.
A second test is whether price still follows its old driver. Correlation measures how closely two series move together, from +1 (in step) through 0 (no link) to -1 (opposite). The currency correlation lesson shows how it is calculated.
In this illustrative case, USD/JPY has tracked the US two-year yield while the market trades a rates story. Its 20-day correlation with that yield reads 0.8, 0.7 and 0.6 over three months, then falls to 0.3 and 0.1.
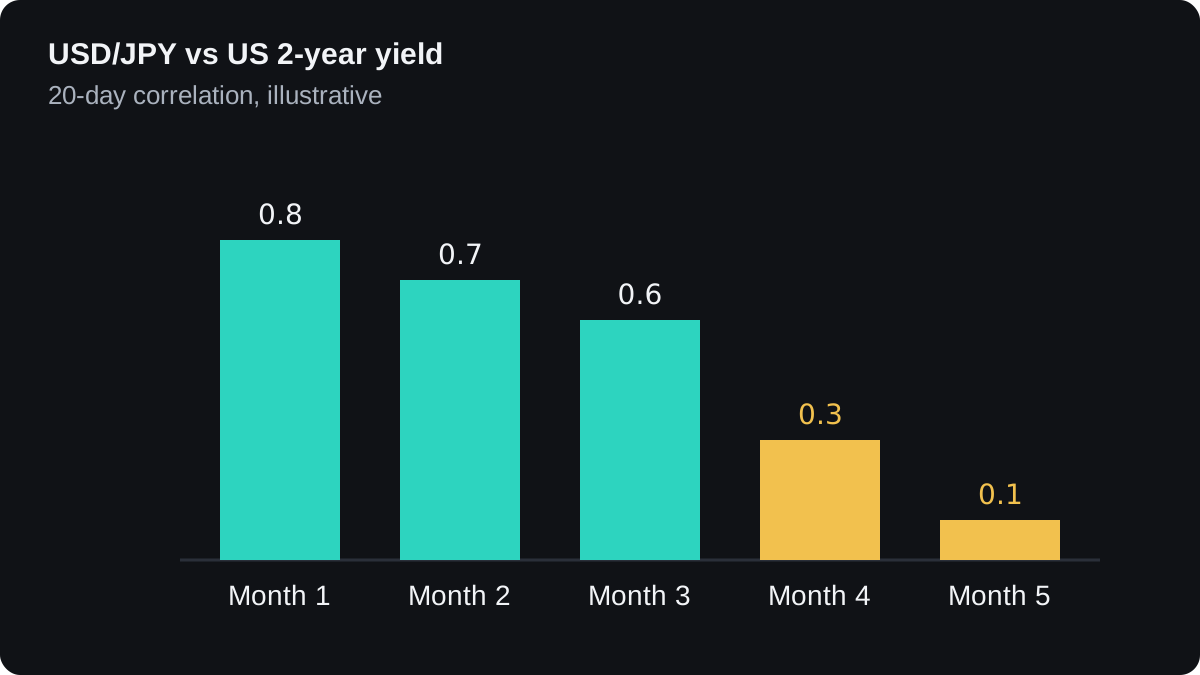
A falling correlation says the yield no longer explains much of the move. It does not name the new driver, so compare the pair with other candidates, such as stock markets or oil, and see which one it now follows.
How does price confirm the new story?
Reactions and rate pricing are early warnings. Price structure gives a later confirmation, because it shows the side that was winning actually giving up ground.
An uptrend makes higher highs and higher lows, as the swing highs and lows lesson shows. In the illustrative EUR/USD path below, lows rise from 1.08000 to 1.08600 to 1.09000, while highs reach 1.09000 and then 1.09600.
The next rally stops at 1.09400, a lower high. Price then falls to 1.08800, which is 1.09000 minus 1.08800 = 0.00200, or 20 pips below the last higher low.
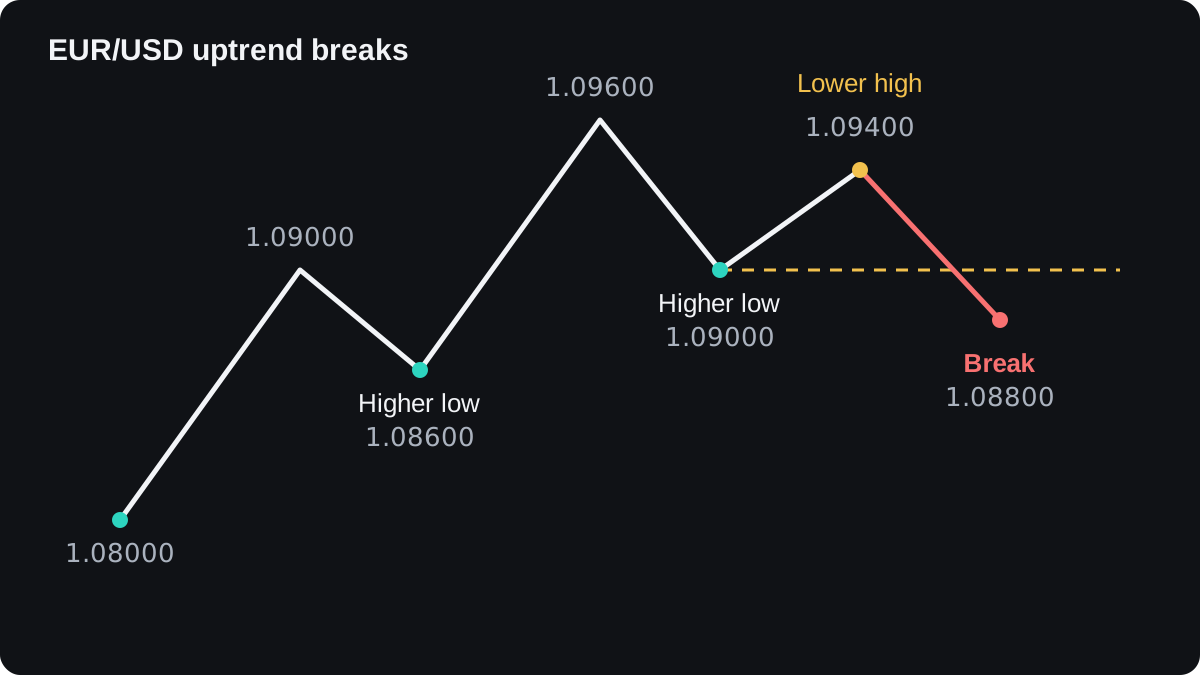
Price alone cannot say why the trend broke. If the break lines up with fading news reactions and changed rate pricing, the case for a new story is stronger than any one sign could make it.
Positioning data can add background. When the Commitments of Traders report shows speculators heavily on one side, less news may be needed to push them out.
That report is weekly and published with a delay, and crowded positions can stay crowded for a long time.
Why are shifts clearer in hindsight?
Every sign above also appears in ordinary noise. Reactions shrink when a strong release was already expected. Correlations drift for weeks and then recover. Trends break a swing low and then resume.
On an old chart the turn looks obvious, because you already know which signals were right. In real time you see the same mix of signals, and some of them lead nowhere.
Reading narratives is a matter of judgement. None of these signs comes with a dependable success rate, and no fixed rule says how many releases make a pattern.
One cautious approach is to wait for signs from at least two different sources before changing your view, and to trade smaller while the story is unclear, so a wrong call costs less.
It helps to write down, in advance, what evidence would make you accept a new story. Setting rules like that before the pressure arrives is the job of a trading plan, the subject of the next module.
Câu hỏi thường gặp
What is a narrative shift in forex?
It is a change in the main question the market uses to price a currency, such as moving from expected rate hikes to expected rate cuts. After a shift, the same data can move the currency differently or in the opposite direction.
How long does a market narrative last?
There is no fixed length. Some stories run for many months, while others fade within weeks after a data surprise or a change in central bank tone.
Can one data release change the narrative?
A single large surprise can start a shift, but one reaction is weak evidence on its own. Look for the same change across several releases, in rate pricing and in price structure.
Which indicator shows a narrative shift?
No single indicator does. News reactions, rate expectations, correlations and price structure each give a partial view, and they are more convincing when they agree.