Bollinger Bands.
Bollinger Bands are three lines on a price chart: usually a 20-period simple moving average in the middle, with bands two standard deviations above and below it. The bands widen when price moves a lot and narrow when it is quiet. A narrow stretch, called a squeeze, often comes before a larger move in either direction.
本頁目前僅提供英文版。

Price on a chart rarely moves at a steady pace. Some days EUR/USD barely drifts, and on others it swings by a full cent.
Bollinger Bands draw that change of pace on the chart. They form an envelope around price that widens when trading gets jumpy and narrows when it goes quiet.
The indicator was developed by John Bollinger in the 1980s and comes built into most charting platforms. It combines a moving average with a measure of how spread out recent prices are.
What are Bollinger Bands made of?
Bollinger Bands are three lines drawn over the price chart. The middle line is a simple moving average, usually of the last 20 closes.
The upper band sits a set distance above that average, and the lower band sits the same distance below it. The distance is two standard deviations of the same 20 closes.
A standard deviation measures how far prices typically sit from their average. When closes cluster tightly it is small, and the bands hug the average. When closes scatter it grows, and the bands spread apart.
The default setting is often written as (20, 2): a 20-period average with bands 2 standard deviations away.
The bands can be drawn on any timeframe, from 1-minute to weekly, because they only use the closes on the chart you are viewing.
How are the bands calculated?
The standard setting uses 20 closes, which makes the arithmetic long. The steps are identical with fewer, so this example uses five illustrative EUR/USD closes. On this pair a pip is 0.0001.
| Candle | Close | Distance from average | Squared |
|---|---|---|---|
| 1 | 1.10100 | −10 pips | 100 |
| 2 | 1.09900 | −30 pips | 900 |
| 3 | 1.10200 | 0 pips | 0 |
| 4 | 1.10500 | +30 pips | 900 |
| 5 | 1.10300 | +10 pips | 100 |
- Add the five closes: the total is 5.51000. Divide by 5 to get 1.10200. That is the middle line.
- Measure each close's distance from 1.10200 in pips, then square it, as in the table.
- Add the squares: 100 + 900 + 0 + 900 + 100 = 2,000. Divide by 5 to get 400.
- Take the square root: √400 = 20. One standard deviation (SD) is 20 pips, or 0.00200.
- Double it to get 40 pips, or 0.00400. The upper band is 1.10200 + 0.00400 = 1.10600, and the lower band is 1.10200 − 0.00400 = 1.09800.
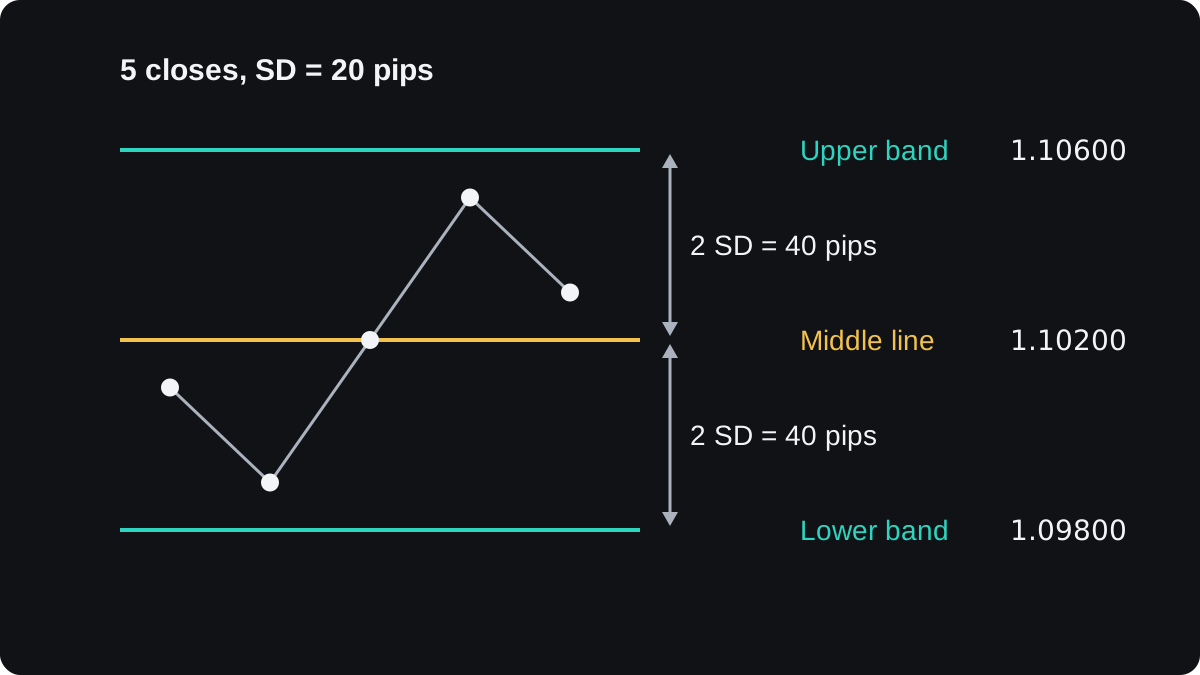
Step 3 divides by the number of closes, which is the population form of the formula used in the original definition. Some software divides by one less, so band values can differ slightly between platforms.
When the next candle closes, the oldest close drops out, the new one comes in, and all three lines are worked out again. That is why the bands bend and stretch as you scroll along a chart.
What does the width of the bands tell you?
The gap between the bands is a picture of recent volatility, meaning how much price has been moving. In the example the bands are 80 pips apart, 40 pips on each side.
Traders often turn the gap into a single number called bandwidth: the upper band minus the lower band, divided by the middle line. Here that is 0.00800 ÷ 1.10200 = 0.00726, or about 0.73%.
Because it is a ratio, bandwidth lets you compare calm and busy spells on one pair, or pairs that trade at very different prices. The volatility lesson covers other ways to measure the same thing.
A second number, %B, shows where price sits inside the bands. It is (price − lower band) ÷ (upper band − lower band), so 0 is the lower band, 0.5 the middle line and 1 the upper band.
If price stood at 1.10500 in the example, %B would be 0.00700 ÷ 0.00800 = 0.875, near the top of the envelope. A reading above 1 means price is outside the upper band, and below 0 means it is under the lower one.
What is a Bollinger squeeze?
Volatility tends to come in cycles. Quiet spells are often followed by sharp moves, and sharp moves often settle down again.
A squeeze is a stretch where the bands pinch close together because price has been quiet. The reason to watch for one is that a calm market often comes before a larger move.
In the illustrative chart below, the bands narrow to 40 pips apart while price drifts sideways. Price then pushes above the upper band, and the gap grows to 120 pips as the move gathers pace.
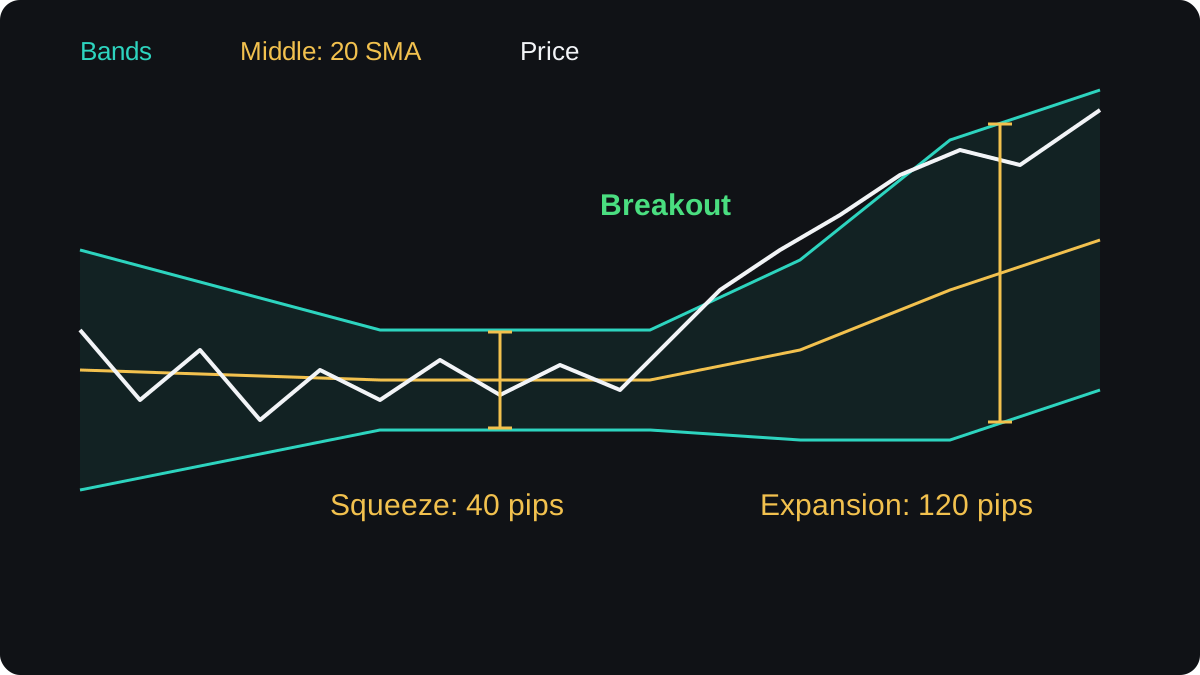
The squeeze has clear limits. It says nothing about direction, because the bands look the same before a rally and before a drop. Its timing is poor too, since a squeeze can last much longer than you expect.
Price can break out of one side, fail, and then run the other way. This is a false breakout, and quiet markets produce plenty of them.
Some traders wait for a candle to close outside a band before acting, and decide before entering where they would exit if the move fails. That reduces some false signals and still lets others through.
Does a touch of the band mean price will turn?
A common beginner reading treats the upper band as overbought and the lower band as oversold. Used alone, that reading fails often, and how it fails depends on the market.
In a ranging market, price swings between two levels, and touches of the outer bands often come near the turns.
In a strong trend, price can press against one band for many candles in a row. This is called walking the band.
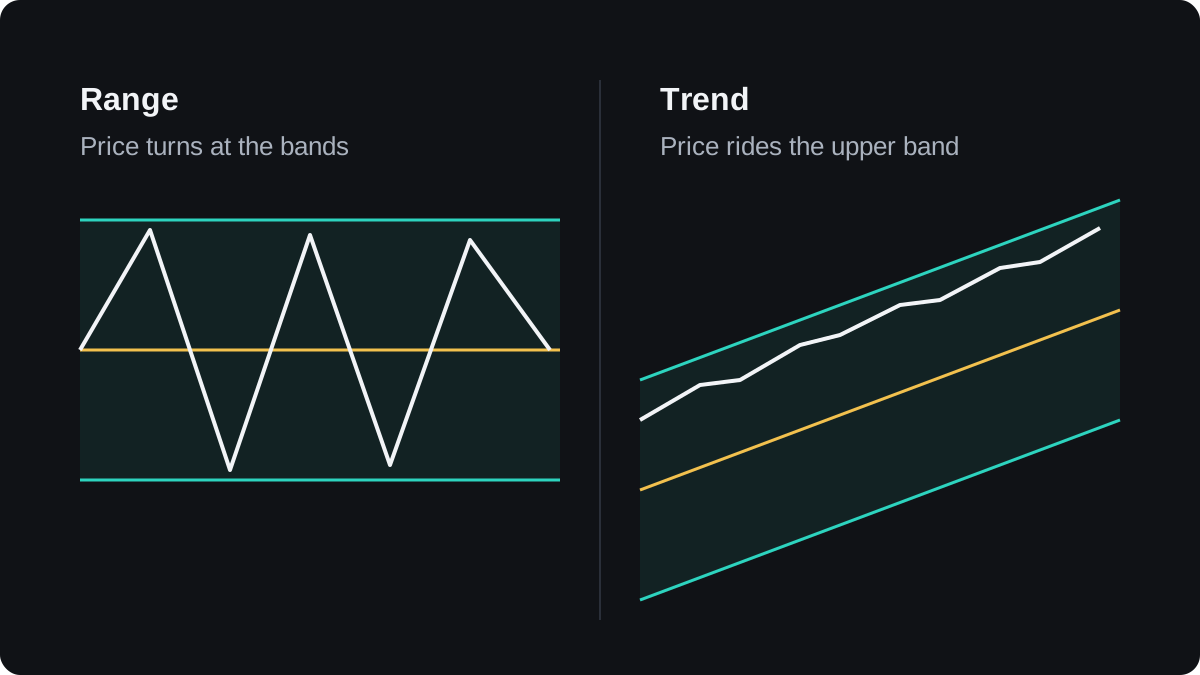
Selling every touch of the upper band in an uptrend means selling into strength again and again. The bands show how far price has stretched from its recent average, and they cannot say whether the stretch will continue or reverse.
The width of 2 standard deviations has a statistical root. If prices followed a normal bell curve, about 95% of values would fall within 2 standard deviations of the average.
Market prices do not follow a bell curve, and large moves happen more often than one would predict. Treat the 95% figure as a rough guide, never as the chance that price stays inside the bands.
How can you use the bands, and where do they fail?
Traders use the bands in a few different ways:
- In a range, the outer bands mark where price has stretched far from its average, an area a range trader may watch for a turn.
- In a trend, the middle line can mark pullbacks, the same way any moving average can, until the trend ends.
- A low bandwidth can flag a squeeze on a chart you already follow.
- %B turns band position into a number you can write into rules or compare with other indicators.
Settings change the picture. A shorter average with narrower bands, such as (10, 1.5), produces more touches and more noise, and a longer average gives fewer, slower signals.
The default (20, 2) has no special accuracy. It is a widely used convention, and any change to it is something to test.
The bands are built from past closes, so they lag. They also cannot tell a range from a trend on their own, which is why they are often read alongside a trend tool such as the ADX.
The lesson on combining indicators shows how to avoid pairing tools that repeat each other.
Tests of simple band rules give mixed results once trading costs are included, and results change with the pair and the timeframe. Test any rule on past data first, as the backtesting lesson explains, then on a demo account.
常見問題
What are the best settings for Bollinger Bands?
The common default is a 20-period simple moving average with bands at 2 standard deviations. No setting is best for every pair and timeframe, so test any change on past and demo data before relying on it.
Is price outside the bands a buy or sell signal?
Not on its own. A close outside a band means price moved further than usual from its average. In a trend that can go on for many candles, while in a range price often drifts back toward the middle line.
What does a Bollinger squeeze mean?
The bands have narrowed because recent price moves were small. A squeeze often comes before a bigger move, but it does not tell you the direction or when the move will start.
Are Bollinger Bands the same as a moving average envelope?
No. An envelope sits a fixed percentage above and below the average, while Bollinger Bands use standard deviation, so their width changes with volatility.
Can you use Bollinger Bands on gold or indices?
Yes. The calculation uses only closing prices, so it applies to any chart, with band widths shown in that market's own price units.
繼續學習
 第 5 章MACD indicator.MACD, short for moving average convergence divergence, measures the gap between a 12-period and a 26-period exponential moving average of price. A 9-period EMA of that gap forms the signal line, and the histogram shows the difference between the two. It is read as momentum, but it lags price and gives many false signals in ranges.
 第 5 章Parabolic SAR.Parabolic SAR is a trend indicator that draws a dot for each bar, below price in an uptrend and above it in a downtrend. The dots move closer to price as the trend extends, and when price crosses them they flip sides. It is often used as a trailing stop, and it gives many false flips in sideways markets.
 第 5 章Stochastic oscillator.The stochastic oscillator shows where the latest close sits within the high to low range of a set number of candles, on a scale of 0 to 100. Readings above 80 are called overbought and below 20 oversold. They describe recent closes near the top or bottom of the range and do not mean price must reverse.
 第 5 章Relative Strength Index (RSI).The Relative Strength Index (RSI) is a momentum indicator that compares the size of recent gains with recent losses and plots the result from 0 to 100. The default uses 14 candles. Readings above 70 are called overbought and below 30 oversold, but in a strong trend RSI can stay beyond those lines for a long time.
 第 5 章Average Directional Index (ADX).The Average Directional Index (ADX) measures how strong a trend is on a scale of 0 to 100, without saying which way it points. Readings above about 25 are commonly read as a trending market and below about 20 as a weak or ranging one. Two companion lines, +DI and −DI, show direction.
 第 5 章Ichimoku Kinko Hyo.Ichimoku Kinko Hyo is a Japanese trend indicator with five lines: a 9-period conversion line, a 26-period base line, two leading spans that form a cloud 26 periods ahead, and the close plotted 26 periods back. Price above the cloud is read as an uptrend bias, below it as a downtrend bias.
 第 5 章How to combine indicators.Combine indicators by giving each one a different job. Use one tool to read the trend's direction or strength, and another to time entries, such as a moving average with RSI. Avoid stacking tools that measure the same thing, like RSI and Stochastic together, because they repeat one signal and only look like confirmation.
 第 5 章Chart indicators cheat sheet.A chart indicator turns past prices into a number or line. Bollinger Bands measure volatility. MACD, Parabolic SAR and Ichimoku follow trend direction. RSI and the stochastic measure momentum, and ADX measures trend strength. Each has a common signal, and each fails in a predictable kind of market, usually trends for oscillators and ranges for trend tools.

