The Commitments of Traders report.
The Commitments of Traders (COT) report is a weekly breakdown, published by the US Commodity Futures Trading Commission, of who holds long and short positions in US futures markets, including currency futures. It shows positions as of Tuesday and usually comes out on Friday, so it is three days old on arrival and leaves out over-the-counter forex.
本頁目前僅提供英文版。

Price shows you where a currency has been. The Commitments of Traders report adds a rough view of who was positioned for the move, at least in one corner of the market: US futures.
The risk-on and risk-off lesson read mood from prices across markets. This report reads it from positions instead. It is free and official, and it is also late and partial, which shapes how you can use it.
What is the COT report?
The Commitments of Traders (COT) report is a weekly table of open positions in US futures and options markets. The Commodity Futures Trading Commission (CFTC), the US regulator for those markets, publishes it.
Positions of large traders, those above reporting levels set by the CFTC, are reported to it by the firms that handle their trades. The weekly report groups these traders by type and shows how many contracts each group holds long and how many short.
For forex, the relevant markets are currency futures on the Chicago Mercantile Exchange (CME): the euro, yen, pound, Swiss franc, and the Canadian, Australian and New Zealand dollars, among others.
The report also covers US dollar index futures, explained in the dollar index lesson.
A futures contract is an exchange-traded agreement with a fixed size and expiry date. The lesson on ways to trade forex compares futures with the spot and CFD trades most retail traders use.
You can read the report on the CFTC website, in its Commitments of Traders section, where current and past reports are free to download. Many charting sites also plot the main figures.
When does it come out, and how old is the data?
Each report captures positions as they stood at the close of business on Tuesday. The CFTC usually releases it on Friday afternoon, US Eastern time. A US public holiday can push the release back by a day or more.
The CFTC plans to publish twice a week by the end of 2026, so check its release schedule.
So the numbers are three days old when they appear. If you read them over the weekend and act on Monday, they describe positions from six days earlier.
The gap widens before the next report. Just before the following Friday, the newest data you hold still describes the Tuesday ten days back.
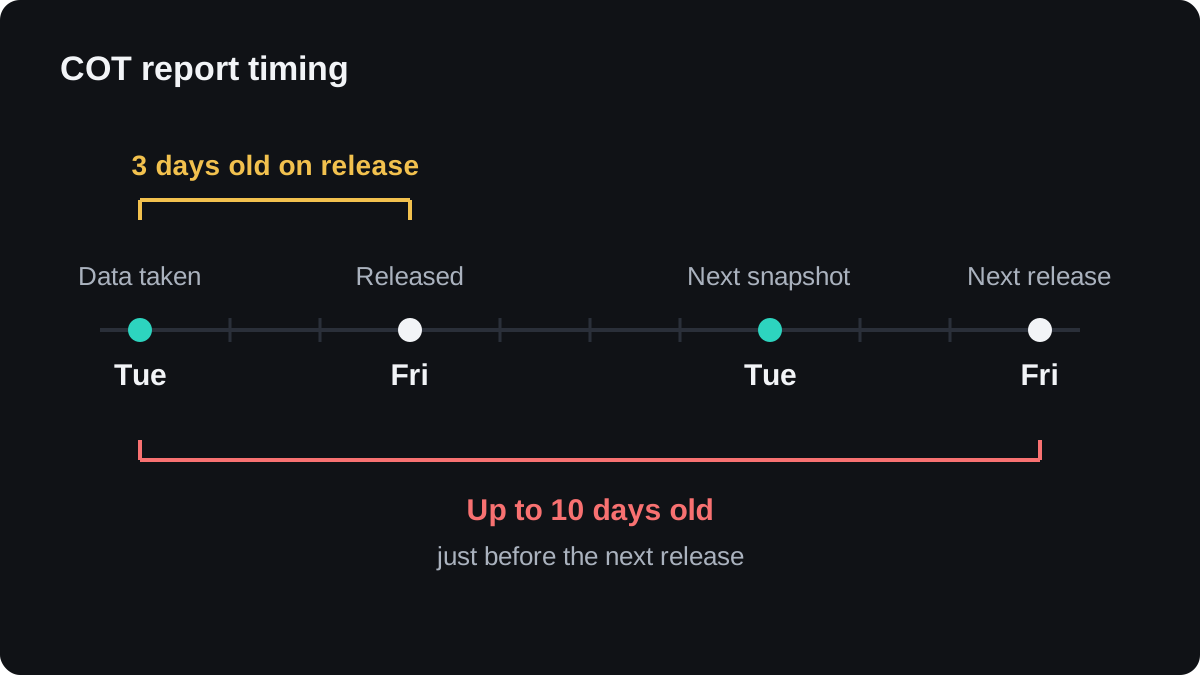
Ten days is a long time in currencies. A central bank decision or a surprise data release can reverse positions within hours, and the report will not show it until the next snapshot is published.
Who are the trader groups?
The CFTC sorts the same positions in more than one way. For currency futures the most detailed version is the Traders in Financial Futures report, often shortened to TFF. It splits reportable traders into four groups.
| Group | Who is usually in it |
|---|---|
| Dealer/Intermediary | Large banks and dealers, often on the other side of client trades |
| Asset Manager/Institutional | Pension funds, insurers, mutual funds and similar investors |
| Leveraged Funds | Hedge funds and other money managers, including commodity trading advisors |
| Other Reportables | Large traders that fit none of the groups above |
A fifth line, nonreportable positions, covers everyone below the reporting threshold. It is worked out by subtraction, so the report never says who those smaller traders are.
The older Legacy report uses three broader groups: commercial, non-commercial and nonreportable. Non-commercial roughly means large speculators, and charting sites that plot COT data often use this split.
Each report comes in a futures-only version and a version that adds options.
Every contract has one buyer and one seller, so across all groups total longs equal total shorts. Either total equals open interest, the number of contracts still open.
How do you read a net position?
The figure traders watch most is the net position: a group's long contracts minus its short contracts. A positive number means the group is net long, a negative one net short.
Here is a worked example with illustrative numbers for Leveraged Funds in euro futures:
- Longs this week: 80,000 contracts. Shorts: 30,000 contracts.
- Net position: 80,000 minus 30,000 = +50,000 contracts.
- Last week the group held 70,000 longs and 35,000 shorts, a net of +35,000.
- Weekly change: 50,000 minus 35,000 = +15,000, so the group became more net long.
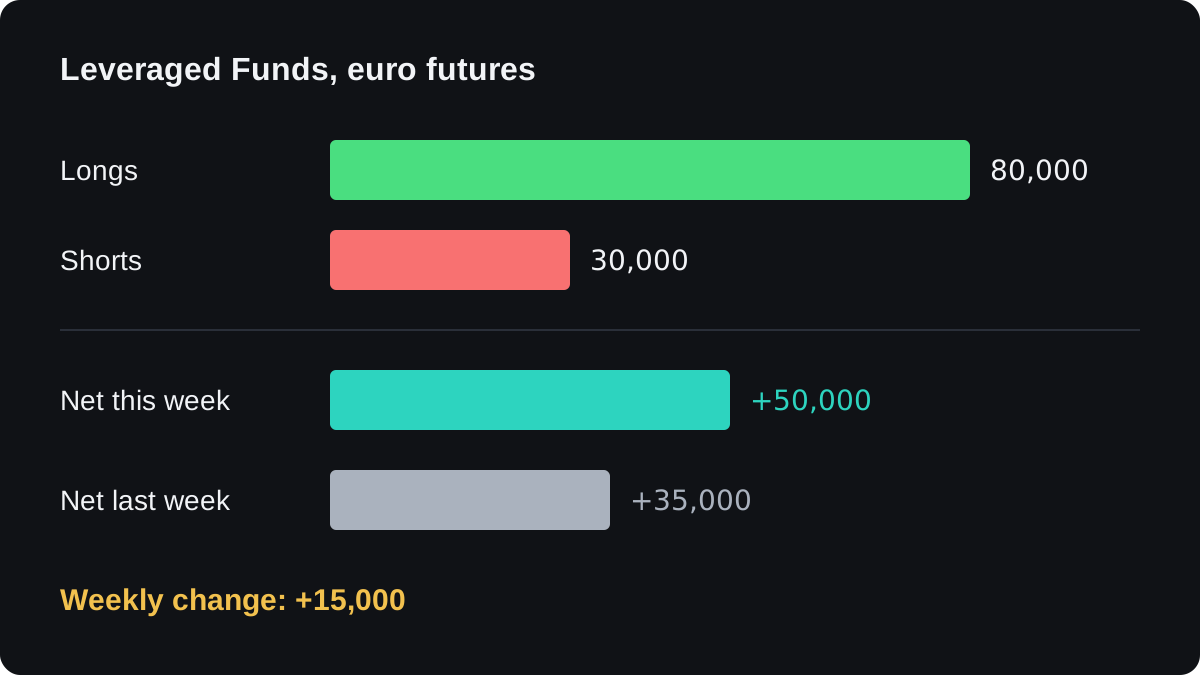
Contracts mean little until you turn them into money. One CME euro futures contract is 125,000 euros, so 50,000 contracts × 125,000 = €6.25 billion. At an illustrative EUR/USD rate of 1.10, that is about $6.875 billion.
Direction needs care. CME currency futures are quoted in US dollars per unit of the foreign currency. A long euro future gains when EUR/USD rises, while a long yen future gains when the yen strengthens, which means USD/JPY falls.
| Net long in this future | Equivalent spot view |
|---|---|
| Euro | Long EUR/USD |
| British pound | Long GBP/USD |
| Australian dollar | Long AUD/USD |
| Japanese yen | Short USD/JPY |
| Canadian dollar | Short USD/CAD |
| Swiss franc | Short USD/CHF |
Mix this up and you will read a bullish yen bet as a bullish dollar bet. The long and short glossary entry recaps how each side gains.
How do traders compare positioning with the past?
A net long of 50,000 contracts could be large for one currency and ordinary for another. One way to judge it is to compare it with the same group's own history.
You place the current net position inside its range over a look-back period you choose, such as three years.
This lesson calls the result a positioning index; charting sites may call it a COT index. The CFTC does not publish it.
The formula gives a number from 0 to 100:
Positioning index = (current net minus lowest net) ÷ (highest net minus lowest net) × 100
Say the Leveraged Funds net position in euro futures ranged from -40,000 to +60,000 over the past three years, and it now stands at +50,000:
- Distance from the low: 50,000 minus (-40,000) = 90,000.
- Width of the range: 60,000 minus (-40,000) = 100,000.
- Index: 90,000 ÷ 100,000 × 100 = 90.
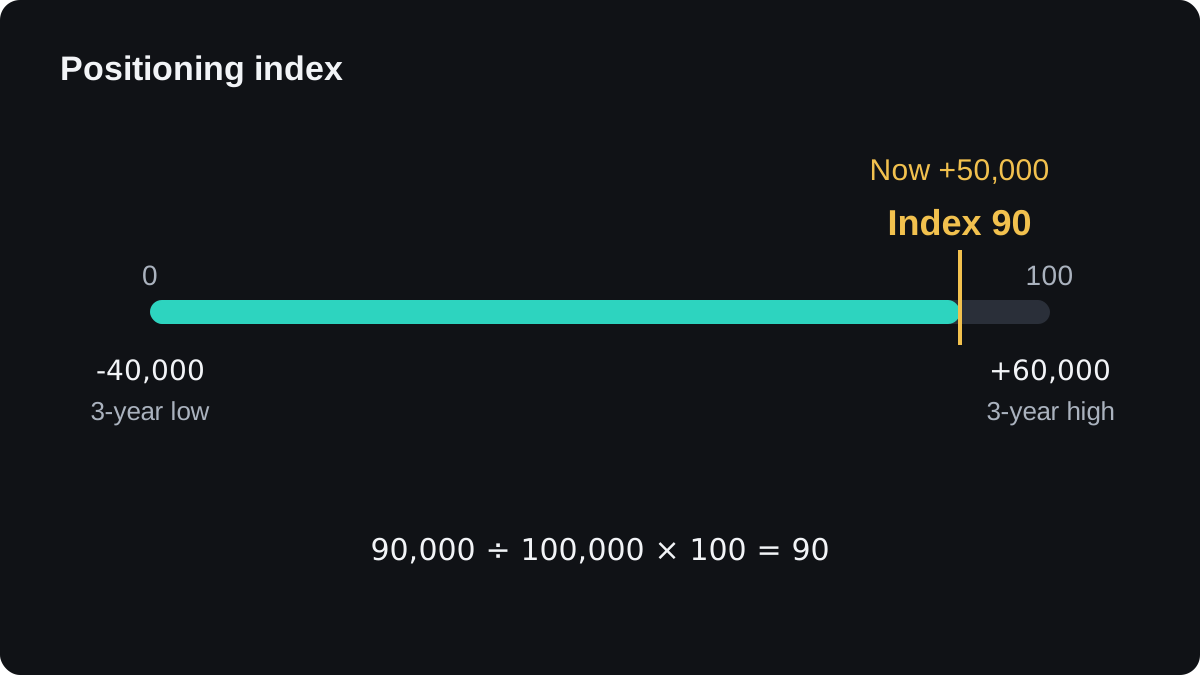
A reading of 90 says this group is close to the most net long it has been in that window. A common use is to treat values near 0 or 100 as crowded positions that may reverse.
The evidence for that idea is mixed. Extremes can last for months while the trend continues, and the reading itself changes with the look-back period you pick.
Where does the COT report fall short?
Coverage is the first gap. The report includes only US exchange-traded futures and options, while most currency trading happens over the counter between banks, funds and brokers. None of those deals appear here.
Futures are a small slice of total forex turnover, so treat the report as a sample of positioning from one venue.
Group labels describe the type of firm. They say nothing about why it holds a position: a fund long euro futures may be hedging European shares it owns, with no view on the euro.
Positions elsewhere stay hidden. A trader shown as net short in futures might hold offsetting forwards or swaps over the counter, which the report cannot see.
The report shows what large traders held a few days ago. It cannot say what they will do next, which is why sentiment analysis reads it alongside price and fundamentals.
Broker data on retail positioning updates far more often. The next lesson, on retail positioning as a contrarian signal, covers that source and its own limits.
常見問題
When is the COT report released?
Usually on Friday afternoon, US Eastern time, with data as of the previous Tuesday. US holidays can delay it, and the CFTC posts its release schedule on its website.
Does the COT report include spot forex?
No. It covers US futures and options markets only, so bank-to-bank spot deals and retail spot or CFD trades with brokers are not in it.
What does net long mean in the COT report?
The group holds more long contracts than short ones. In yen, Swiss franc and Canadian dollar futures, net long means the group is positioned for that currency to rise against the US dollar.
Is the COT report a good trading signal?
It is a slow, partial view of positioning. Extreme readings have a mixed record as reversal signals and can persist for months, so it is usually read alongside price and fundamentals.
Who are leveraged funds in the COT report?
In the Traders in Financial Futures report, Leveraged Funds are hedge funds and other money managers, including commodity trading advisors. Their positions can still include hedges as well as speculative bets.
繼續學習
 第 8 章Risk-on and risk-off.Risk-on is a market mood where investors buy shares, commodities and higher-yielding currencies such as the Australian dollar. Risk-off is the opposite: fear rises and money moves toward safe havens, mainly the Japanese yen, the Swiss franc and often the US dollar. The pattern is a tendency, and interest rates or local news can break it.
 第 8 章Retail positioning as a contrarian signal.Retail positioning data shows what share of one broker's clients are long or short a pair. Contrarian traders read it in reverse: a crowd heavily long hints the price may fall, since retail traders tend to buy into declines. It is a weak, one-broker signal that can stay extreme for weeks, so it needs a chart and testing.

