Line, bar and candlestick charts explained.
A line chart joins the closing price of each period into one line. A bar chart draws each period from its high to its low, with a tick on the left for the open and one on the right for the close. A candlestick shows the same four prices, with a thick body between open and close.
本頁目前僅提供英文版。
Open any trading platform and the first thing on screen is a chart. It records where price has been, one period at a time, and it is where technical analysis starts.
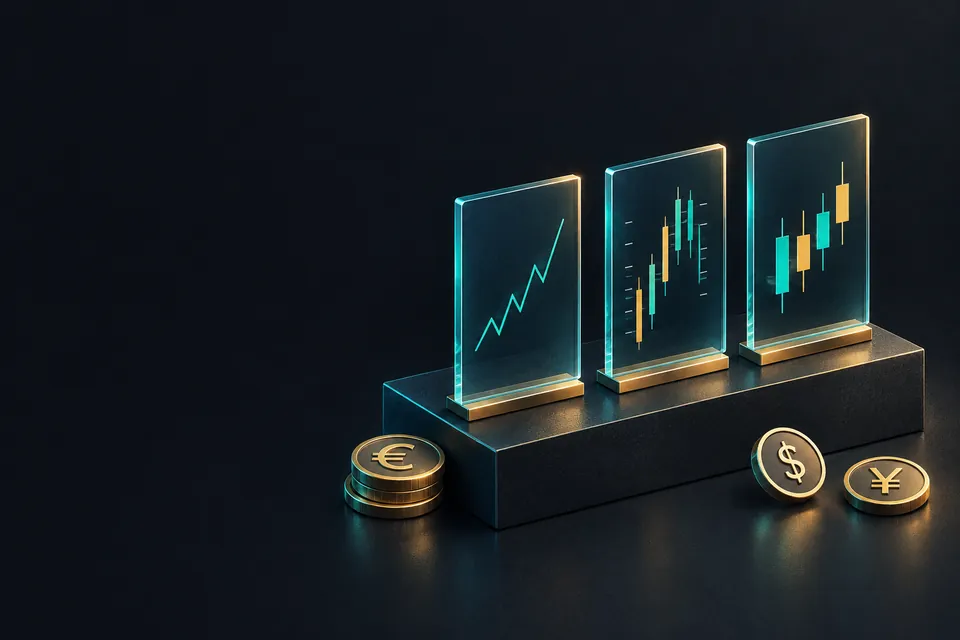
Three chart types cover almost everything you will meet: line, bar and candlestick. All three are built from the same four prices per period. They differ in how many of those prices they let you see.
What do open, high, low and close mean?
Take one hour of EUR/USD, with round illustrative prices. The hour starts at 1.08500, climbs as high as 1.08650, dips as low as 1.08420 and ends at 1.08600.
Those four numbers are the open, high, low and close of the hour, written OHLC for short. The open is the first price of the period, the close is the last, and the high and low are the extremes in between.
You can measure the hour in pips. On EUR/USD one pip is 0.0001:
- The range is high minus low: 1.08650 − 1.08420 = 0.00230, which is 23 pips.
- The change is close minus open: 1.08600 − 1.08500 = 0.00100, which is 10 pips up.
The period can be any length, and that length is the chart's timeframe. A one minute chart draws one shape per minute and a daily chart one per day. MetaTrader labels them M1, M15, H1, H4, D1 and so on.
Drawn as a line, that hour shrinks to a single point at the close, 1.08600. A bar and a candle both keep all four prices.

How does a line chart work?
A line chart plots one price per period, almost always the close, and joins the points. Everything that happened inside each period is left out.
That gives the cleanest picture of direction. Over a year of daily closes, a line chart shows the trend with very little clutter.
The price of that simplicity is hidden information. Take five hours of EUR/USD that close at 1.08540, 1.08520, 1.08510, 1.08580 and 1.08600. As a line, that looks like a calm drift inside 9 pips.
In the third hour, though, price fell to 1.08300 before it recovered. That is 1.08510 − 1.08300 = 0.00210, or 21 pips below the hour's close, and the line never goes lower than 1.08510.

Suppose you had bought and placed a stop loss 15 pips below the line's low, at 1.08360. Price reached 1.08300 in that hour, so the stop would have been hit, and the line chart shows no trace of it.
How does a bar chart work?
A bar chart, also called an OHLC chart, draws each period as a vertical line from its high to its low. A short tick on the left marks the open, and a short tick on the right marks the close.
For the first example hour, the bar runs from 1.08420 at the bottom to 1.08650 at the top. It is the middle shape in the first figure.
The left tick sits at 1.08500 and the right tick at 1.08600. The right tick is higher, so the hour closed up.
Many platforms also colour each bar by direction. A bar chart holds every price a candlestick does, in thinner strokes that some people find harder to scan across many periods.
How does a candlestick work?
A candlestick draws the same four prices in a bolder shape. The thick part, the body, spans the open and the close. The thin lines above and below, called wicks or shadows, reach the high and the low.
Colour shows direction. When the close is above the open, the candle is bullish and usually drawn green or hollow. When the close is below the open, it is bearish and usually red or filled.
These colours are a setting, so check what your platform uses before you read a chart.
Here is a falling hour with round illustrative prices: open 1.08600, high 1.08640, low 1.08380, close 1.08450. It splits into three parts:
- Body, open minus close: 1.08600 − 1.08450 = 0.00150, or 15 pips.
- Upper wick, high minus the top of the body: 1.08640 − 1.08600 = 0.00040, or 4 pips.
- Lower wick, bottom of the body minus low: 1.08450 − 1.08380 = 0.00070, or 7 pips.
- Check: 15 + 4 + 7 = 26 pips, the same as the range, 1.08640 − 1.08380 = 0.00260.
The rising hour from the first example splits the same way: a body of 10 pips, an upper wick of 5 and a lower wick of 8, which add up to its 23 pip range.

A long lower wick says price traded well below the body during the period and then came back.
What that means for the next period is a separate question, covered in how to read a candlestick. No single candle is a reliable forecast on its own.
What a forex chart leaves out
Most retail platforms, MetaTrader included, chart the bid price. Buy orders trigger at the ask, which sits above the bid by the spread, so a buy limit can stay unfilled even when the chart touches its price.
The bid and ask lesson explains the two prices in detail.
Forex trades around the clock on weekdays, so there is no single official daily open. Each broker cuts its daily candles at its own server midnight.
Two platforms can therefore show different daily highs, lows and closes for the same pair. Prices also come from each broker's own feed, as the lesson on where your broker's prices come from explains, so small gaps between platforms are normal.
There is no central exchange either. The volume shown under a forex chart is usually tick volume, a count of price changes in the period, and it does not measure how much money changed hands.
How do the three chart types compare?
| Chart type | Prices per period | Easiest to see | Limit |
|---|---|---|---|
| Line | Close only | Overall direction | Hides highs, lows and opens |
| Bar | Open, high, low, close | Exact range of each period | Thin ticks are hard to read when zoomed out |
| Candlestick | Open, high, low, close | Direction and range together | Easy to read too much into one candle |
All three draw the same data, and switching type changes only how much of it you see. Any demo account lets you flip between them on the same pair, which is the quickest way to compare.
Which type fits your trading is the subject of the next lesson, which chart type should you use.
常見問題
What is the difference between a bar chart and a candlestick chart?
Both show the open, high, low and close of each period. A bar marks the open and close with small side ticks, while a candlestick fills the space between them as a body, which makes direction easier to see.
Why does a line chart use the close?
The close is the last price of each period, so it is the usual way to sum up that period in one point. Some charting tools let you plot a different price instead.
What does a green candle mean?
On most default settings, a green candle closed higher than it opened. Colours are a platform setting, so some charts use white or hollow candles for rising periods.
Why do daily candles differ between two platforms?
Each broker closes its daily candle at its own server time and uses its own price feed. The open, high, low and close can therefore differ slightly for the same pair and day.
Is the volume on a forex chart real trading volume?
Usually not. Forex has no central exchange, so most retail charts show tick volume, the number of price changes in each period.