Tweezer tops and bottoms.
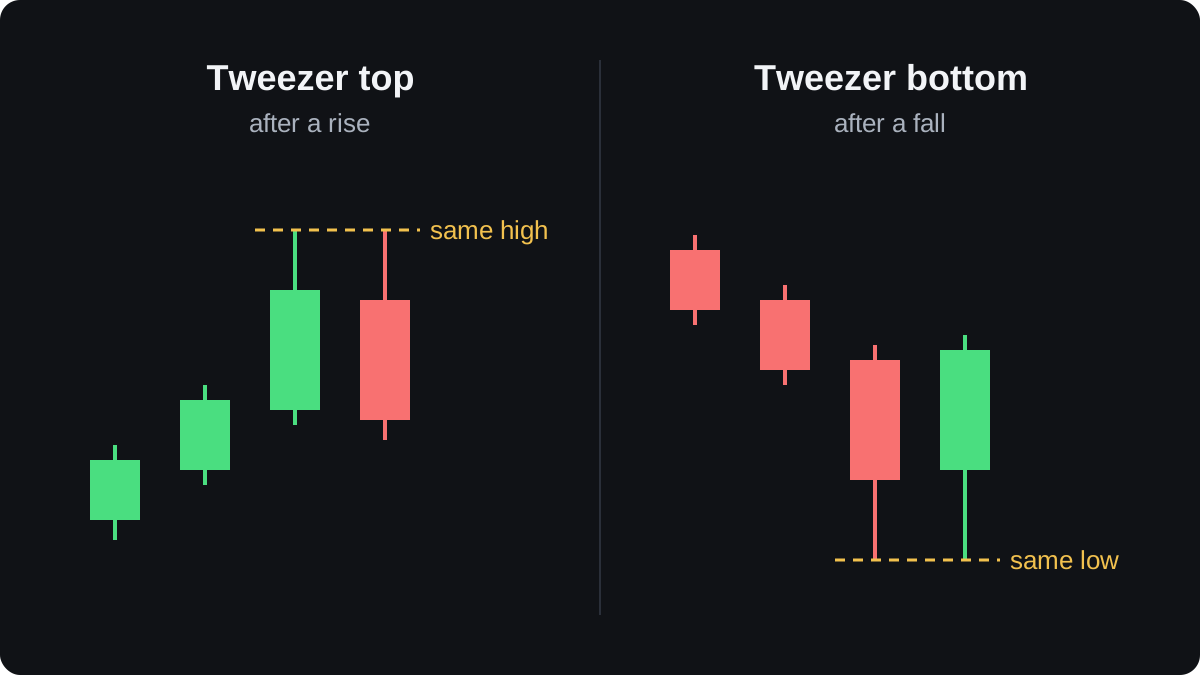
A tweezer top is two candles, usually side by side, that reach almost the same high after a rise. A tweezer bottom is two candles with almost the same low after a fall. Both show a price the market rejected twice. They mean most at a known level and are weak signals on their own.
本頁目前僅提供英文版。

Price climbs to 1.10500 and slips back. On the next candle it climbs to almost the same price and fails again. Two candles have tested one level, and sellers pushed price away both times.
That pair of candles is called a tweezer. It marks a price the market rejected twice in a row.
What does a tweezer top or bottom look like?
A tweezer top forms after a rise. Two candles, usually next to each other, reach almost the same high. In the textbook version the first candle is bullish and the second is bearish.
That order tells a short story. Buyers pushed price up to a level, then on the second candle sellers took it back down from the same place.
A tweezer bottom is the mirror image after a fall. Two candles share almost the same low, usually a bearish candle followed by a bullish one. The name comes from the two matching wick tips, which look like the ends of a pair of tweezers.
If bodies and wicks are still new to you, start with how to read a candlestick.
The second candle is often another pattern as well. A tweezer top whose second body covers the first body is also a bearish engulfing pattern.
A tweezer bottom whose second candle has a long lower wick may also be a hammer. When two matching highs sit several candles apart, they are usually read as a small double top instead.
How close do the two highs or lows need to be?
Exact matches are rare when prices are quoted to five decimals. There is no official tolerance, so you have to judge it.
A simple test compares the gap with the size of the candles. A 2 pip gap between candles that are each 40 pips tall is a close match.
The same 2 pip gap between candles 4 pips tall is half a candle, which is no match.
Watch the pip size on yen pairs. On USD/JPY, lows of 149.20 and 149.22 are 0.02 apart, which is 2 pips, because a pip on a JPY pair is 0.01.
Your chart may also differ from someone else's. Brokers build prices from different feeds, and MetaTrader charts normally plot the bid price.
One broker can show matching highs where another shows a gap of 1 or 2 pips. Treat the tweezer level as a narrow zone rather than an exact price.
Why does location matter so much?
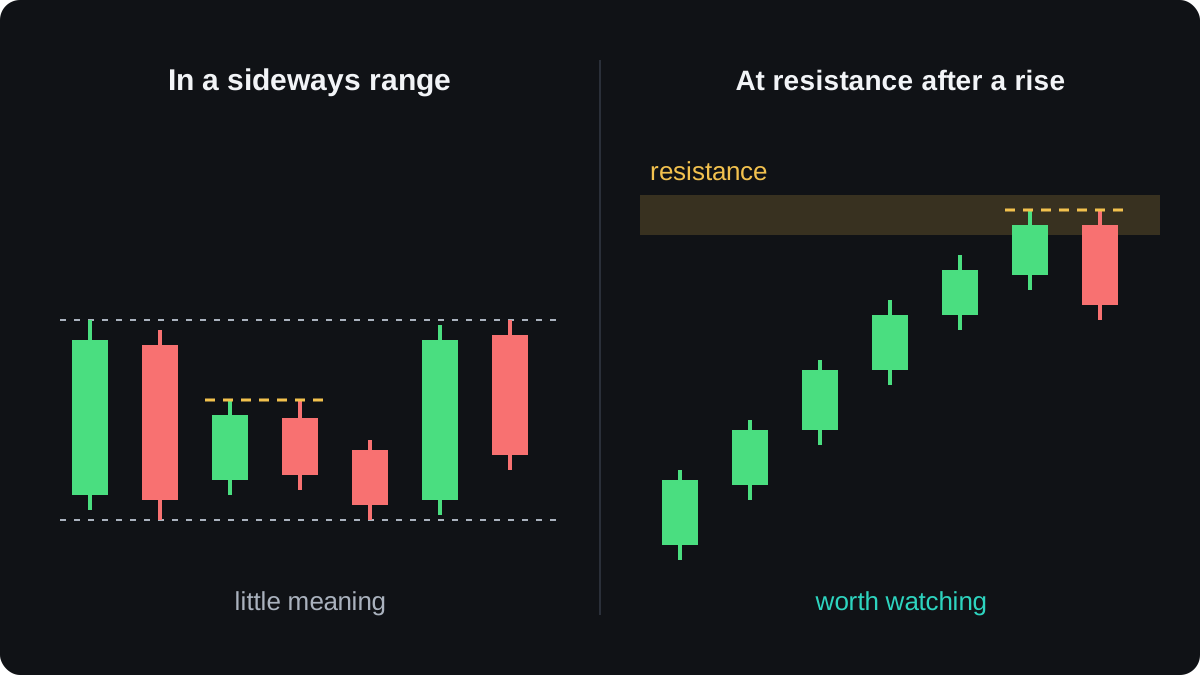
On a quiet 5-minute chart, two candles often share a high just because little is happening. A tweezer deserves attention only when it appears somewhere that matters.
Two conditions give it more weight. The first is a clear move into the pattern, since a tweezer top needs a rise to reverse.
The second is a level price has reacted to before, such as support or resistance, a round number or a recent swing high.
Timeframe matters too. A tweezer on a daily chart reflects two full days of trading that stopped at one price. The same shape on a 1-minute chart covers two minutes and can come from very little activity.
How might a trader plan a tweezer top trade?
The prices below are illustrative round numbers on a 4-hour chart. The plan shows the method only and is no recommendation to trade the pattern.
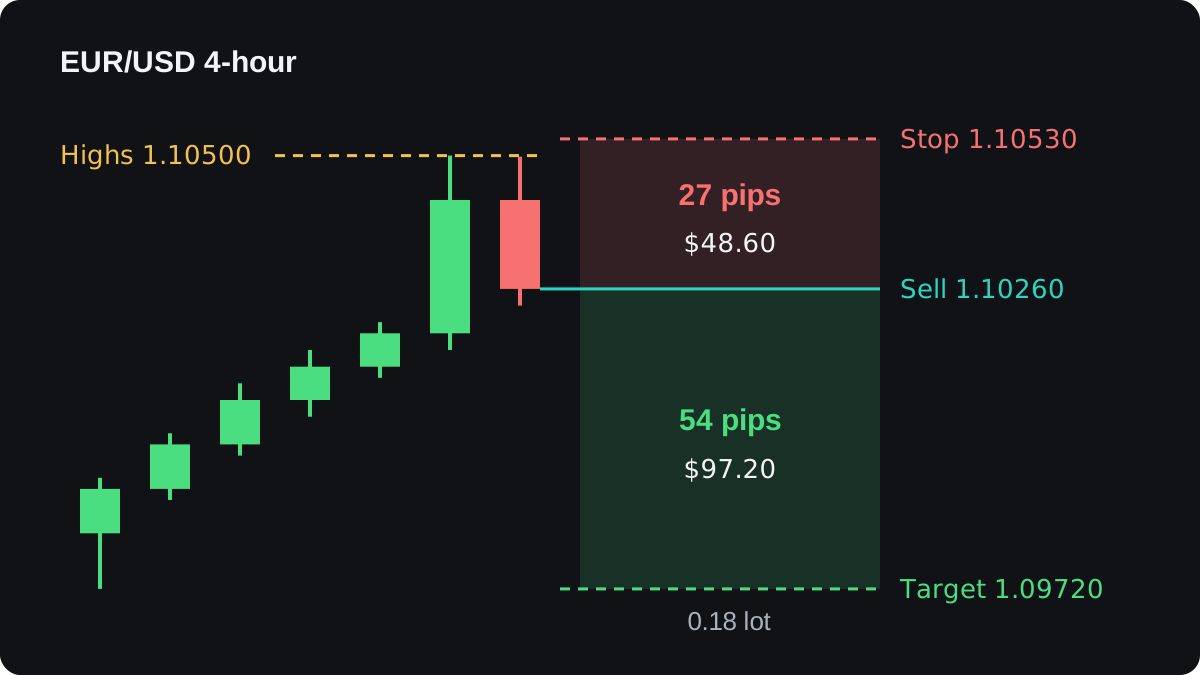
EUR/USD has risen for several candles toward 1.10500, where it turned lower once before. Then two candles form:
| Candle | Open | High | Low | Close |
|---|---|---|---|---|
| 1 (bullish) | 1.10180 | 1.10500 | 1.10150 | 1.10420 |
| 2 (bearish) | 1.10420 | 1.10498 | 1.10230 | 1.10260 |
The highs are 0.00002 apart, which is 0.2 pip, so they match. Candle 1 gained 24 pips from open to close, and candle 2 gave back 16 of them, two thirds of the gain.
- Entry: you sell at 1.10260, the close of the second candle.
- Stop: you place the stop loss 3 pips above the higher of the two highs, so 1.10500 + 0.00030 = 1.10530.
- Risk in pips: 1.10530 minus 1.10260 = 0.00270, which is 27 pips.
- Size: with a $5,000 account and a plan to risk 1%, you can lose $50. In a US dollar account one standard lot of EUR/USD is worth $10 per pip, so $50 ÷ 27 = $1.85 per pip, or 0.185 lot. Lots go in steps of 0.01, so round down to 0.18 lot, worth $1.80 per pip.
- Money at risk: 27 × $1.80 = $48.60.
- Target: the last swing low is 1.09720. The distance is 1.10260 minus 1.09720 = 0.00540, or 54 pips, worth 54 × $1.80 = $97.20 if price gets there.
These sums leave out spread and commission. A short position closes with a buy at the ask, while the chart shows the bid, so a stop above a bid-chart high also needs room for the spread.
Some traders wait for confirmation, selling only after a later candle closes below the second candle's low of 1.10230. Say that candle closes at 1.10200, with the stop and target unchanged:
| Sell at close of candle 2 | Wait for close below 1.10230 | |
|---|---|---|
| Entry | 1.10260 | 1.10200 |
| Stop | 1.10530 | 1.10530 |
| Risk | 27 pips | 33 pips |
| Target distance | 54 pips | 48 pips |
| Size for $50 risk | 0.18 lot | 0.15 lot |
| Money at risk | $48.60 | $49.50 |
Waiting skips the trades where price never breaks lower. The cost is a worse entry and a smaller reward for the same risk. The lot size calculator repeats step 4 for any pair and account size.
Where do tweezers fail?
In a strong trend, price can pause at a level, print two matching highs and then break straight through. A tweezer shows that a level held for two candles and tells you nothing certain about the third.
Stops tend to gather just beyond the matching highs or lows, because that is where traders acting on the pattern place them. A quick spike through the level can trigger those stops before price turns, so the trade loses even if the reversal comes later.
The evidence is thin as well. There is no strong, widely accepted research showing that tweezers alone predict forex moves after costs.
Treat a tweezer as a reason to study a level more closely, and let your stop and position size decide what a wrong call costs.
常見問題
Is a tweezer top bullish or bearish?
A tweezer top is read as bearish because it appears after a rise and shows a high that held twice. A tweezer bottom is read as bullish. Neither one guarantees a reversal.
Do the two highs have to be exactly the same?
No. A gap of a pip or two is a reasonable match when the candles are much taller than the gap, so compare the gap with the size of the candles.
What is the difference between a tweezer top and a double top?
A tweezer top uses two candles, usually side by side. A double top has two peaks separated by a dip that can last many candles, so it takes longer to form.
Which timeframe is best for tweezer patterns?
No timeframe makes the pattern reliable. On 4-hour and daily charts tweezers are rarer and each one reflects more trading, so short-term noise plays a smaller part.
Where should the stop loss go on a tweezer trade?
A common choice is a few pips beyond the matching highs or lows, plus room for the spread. If price trades past that level, the reason for the trade is gone.
繼續學習
 第 2 章How to read a candlestick.A candlestick shows four prices for one trading period: the open, high, low and close. The thick body runs from open to close, and the thin wicks reach the high and the low. A candle that closed above its open is bullish, usually green, and one that closed below is bearish, usually red.
 第 2 章What candle bodies and wicks tell you.A candle's body shows the move from open to close, and its wicks show prices reached but not kept. A long body means price moved far and held it; a short body means open and close ended near each other. A long lower wick shows a drop bought back, and a long upper wick a rise sold off.
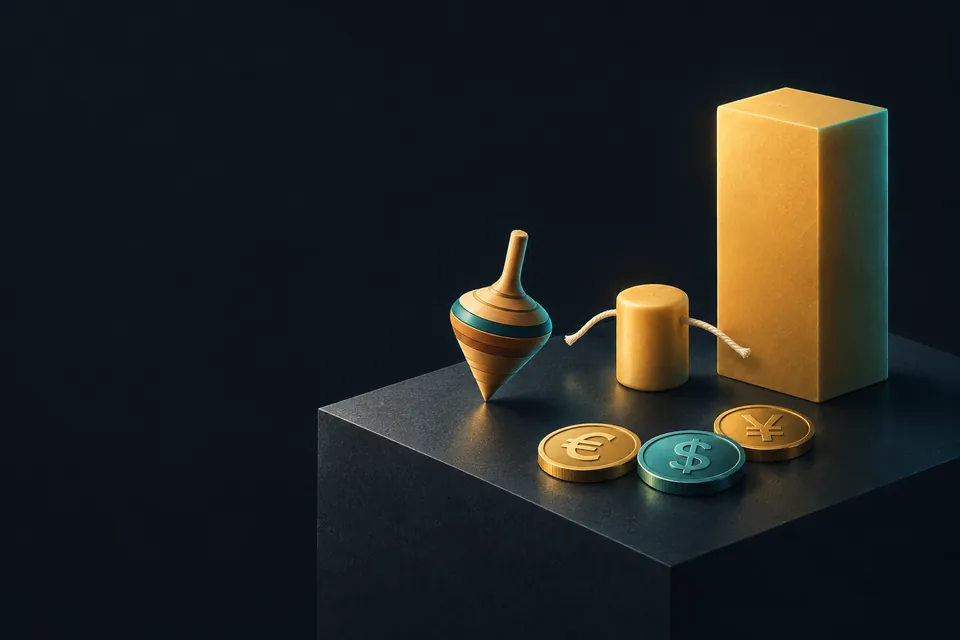 第 2 章Spinning tops and marubozu candles.A spinning top is a candle with a small body and wicks on both sides longer than the body, showing that buyers and sellers ended the period roughly even. A marubozu is the opposite: a long body with little or no wick, showing one side controlled the period from open to close. Neither predicts the next move alone.
 第 2 章Doji candles and what they signal.A doji is a candle that opens and closes at almost the same price, so its body is a thin line. It shows buyers and sellers ended the period even. The four common types are standard, long-legged, dragonfly and gravestone. A doji alone is a weak signal; context and the next candle matter.
 第 2 章Hammer and hanging man patterns.A hammer and a hanging man are the same candle: a small body near the top and a lower wick at least twice as long. After a fall it is a hammer, a hint that selling may be fading. After a rise it is a hanging man, a warning that buying may be tiring. Each needs a confirming next candle.
 第 2 章Inverted hammer and shooting star patterns.An inverted hammer and a shooting star are the same candle: a small body near the low and a long upper wick, usually at least twice the body. After a fall it is an inverted hammer, a possible turn up. After a rise it is a shooting star, a possible turn down. Both need a confirming close.
 第 2 章Bullish and bearish engulfing patterns.An engulfing pattern is a two-candle reversal signal. A bullish engulfing forms after a decline, when a rising candle's body completely covers the previous falling candle's body. A bearish engulfing is the mirror image after a rise. It suggests control has switched sides, but it often fails in ranges and means more at a support or resistance level.
 第 2 章Morning star and evening star patterns.A morning star is a three-candle pattern at the end of a fall: a long bearish candle, a small-bodied star near the low, then a long bullish candle that closes above the first candle's midpoint. An evening star is the mirror image after a rise. Both suggest a possible reversal, and neither guarantees one.
 第 2 章Three white soldiers and three black crows.Three white soldiers is three bullish candles in a row after a decline, each closing higher and near its high. Three black crows is the bearish mirror after a rise. Both suggest one side has taken control, but they often appear after a large move, can fail, and are best read with the trend and a planned stop.
 第 2 章Three inside up and three inside down.Three inside up is a three-candle bullish reversal pattern: a long bearish candle, a small bullish candle whose body sits inside it, then a bullish candle that closes above the first candle's open. Three inside down is the mirror image after a rise. Both are a harami plus a confirming candle, and neither is a reliable signal on its own.
 第 2 章Candlestick patterns cheat sheet.A candlestick pattern is a shape made by one, two or three candles that hints at who controlled price. Single candles such as the doji, hammer and shooting star show rejection or indecision. Two- and three-candle patterns such as engulfing and morning star show a shift. None predicts price reliably on its own.

