Three white soldiers and three black crows.
Three white soldiers is three bullish candles in a row after a decline, each closing higher and near its high. Three black crows is the bearish mirror after a rise. Both suggest one side has taken control, but they often appear after a large move, can fail, and are best read with the trend and a planned stop.
本頁目前僅提供英文版。

Picture EUR/USD after several days of falling candles. Then three green candles print in a row, each closing higher than the last and each closing near its high. That run is called three white soldiers.
Its mirror image at the top of a rise is three black crows: three red candles in a row, each closing lower and near its low.
Both are three-candle reversal patterns. They show one side in control for three sessions straight, which is why chart readers watch them as possible signs of a new trend.
The catch is that much of the move is often over by the time the pattern is complete.
What do three white soldiers look like?
Three white soldiers is a set of three bullish candles that appears after a decline. The name comes from traditional charts, where rising candles were drawn white. Most platforms today colour them green.
Each candle should meet these conditions:
- It closes higher than the candle before it.
- It opens inside the body of the previous candle, or at its close.
- It has a large body and closes at or near its high, so the upper wick is short.
The body is the part between the open and the close. If those terms are new, how to read a candlestick covers them. Full bodies with tiny wicks make these candles close cousins of the marubozu.
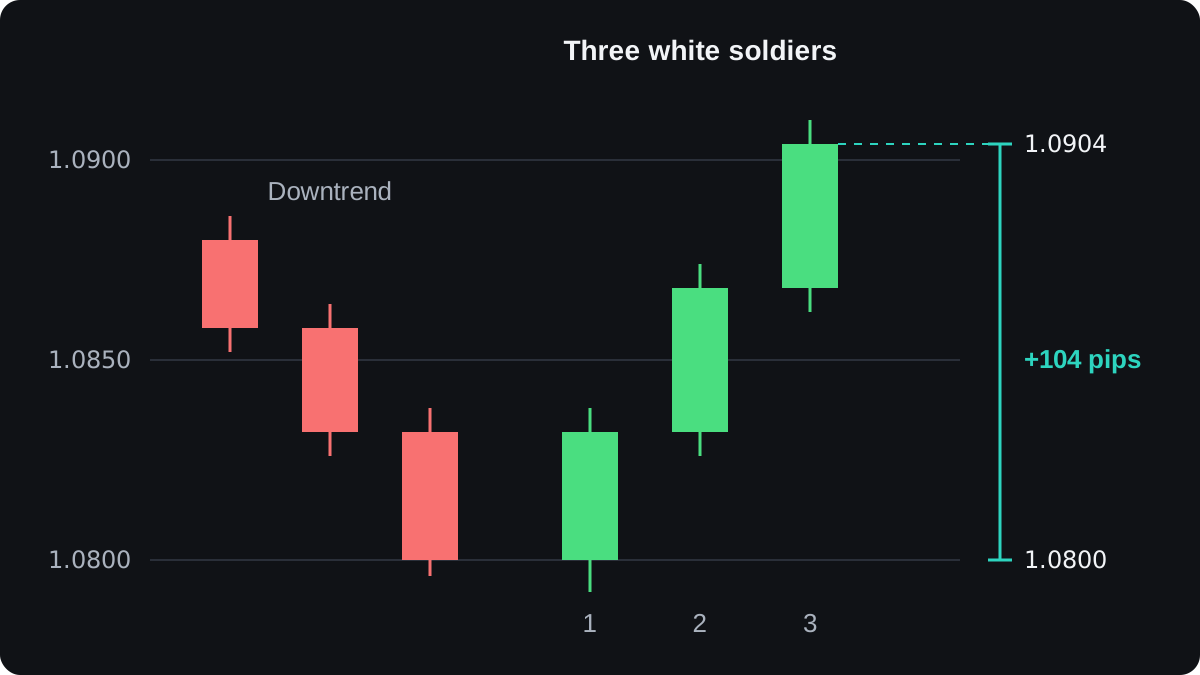
Here is an illustrative example on a EUR/USD daily chart, where a pip is 0.0001. Price had fallen from 1.0880 to 1.0800 over three red candles before the first soldier.
| Candle | Open | High | Low | Close | Body |
|---|---|---|---|---|---|
| 1 | 1.0800 | 1.0838 | 1.0792 | 1.0832 | 32 pips |
| 2 | 1.0832 | 1.0874 | 1.0826 | 1.0868 | 36 pips |
| 3 | 1.0868 | 1.0910 | 1.0862 | 1.0904 | 36 pips |
Each close beats the one before. Each upper wick is 6 pips: 1.0838 minus 1.0832 for the first candle, and the same gap for the other two.
From the first open to the last close, price rose 1.0904 minus 1.0800 = 0.0104, which is 104 pips.
What do three black crows look like?
Three black crows is the bearish version: three red candles after a rise, each closing lower than the last and at or near its low. Short lower wicks show that sellers held the price down into each close.
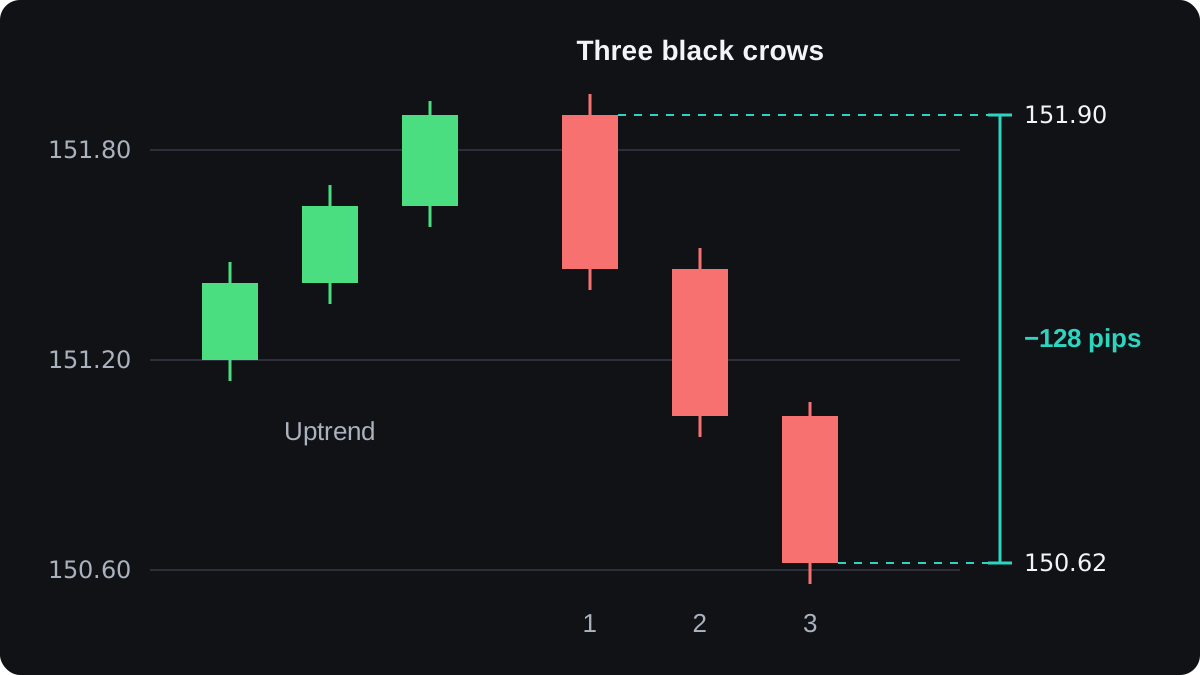
This example uses USD/JPY, again with illustrative prices. On yen pairs a pip is 0.01. Price had climbed to 151.90 before the first crow.
| Candle | Open | High | Low | Close | Body |
|---|---|---|---|---|---|
| 1 | 151.90 | 151.96 | 151.40 | 151.46 | 44 pips |
| 2 | 151.46 | 151.52 | 150.98 | 151.04 | 42 pips |
| 3 | 151.04 | 151.08 | 150.56 | 150.62 | 42 pips |
Each lower wick is 6 pips: 151.46 minus 151.40 on the first candle, and the same on the next two. Price fell from 151.90 to 150.62, a drop of 1.28, which is 128 pips.
When does the pattern carry real information?
Where the candles appear matters more than their shape. Three strong green candles in the middle of an uptrend are an uptrend carrying on, with nothing reversed.
The pattern only points to a reversal when it follows a clear move the other way. It carries more weight when it also breaks out of a flat range or through a level such as support or resistance.
In forex, one of the classic rules does little work. The market trades around the clock on weekdays, so a new candle usually opens at or very near the previous close.
That means the rule about opening inside the prior body is nearly always met, except across a weekend gap.
The closes and the wicks do the filtering instead. Bodies that stay similar in size, or grow, show steady pressure.
Short wicks on the trend side show the closes were held. For soldiers that means short upper wicks, and for crows short lower wicks.
Timeframe changes what the pattern means. Three candles on a 5-minute chart cover 15 minutes and can be one burst of orders around a news release. On a daily chart the same shape covers three trading days.
When are three strong candles a warning?
The pattern has weaker versions with their own names. In an advance block, each soldier still closes higher, but the bodies shrink and the upper wicks grow. Buyers keep pushing and get less for it each day.
A stalled pattern, also called deliberation, has two strong soldiers followed by a small third candle near the high, often a spinning top. The rise has paused, and a turn from there is possible.
Crows have the same weak forms in reverse: shrinking red bodies with growing lower wicks, or a small third candle near the low.
| Version | Bodies | Trend-side wicks | Reading |
|---|---|---|---|
| Three white soldiers | Similar or growing | Short | Buyers in control |
| Advance block | Shrinking | Growing | Buying is tiring |
| Stalled pattern | Third one small | Varies | Rise is pausing |
The bigger problem is distance. The EUR/USD example had already risen 104 pips before the pattern was confirmed. Sharp runs are often followed by a pause or a pullback, so the next candle can move against anyone who bought the third close.
The evidence for these patterns is also thinner than their fame suggests. Published tests of candlestick patterns give mixed results, and a rule that held on one market or timeframe can fail on another.
Treat the pattern as one clue among several. Before relying on any rule built on it, backtest it on your own pairs and timeframe.
How do the stop and position size fit the pattern?
The size of the pattern sets the size of the risk. This is an example of the arithmetic, not a recommendation to take the trade.
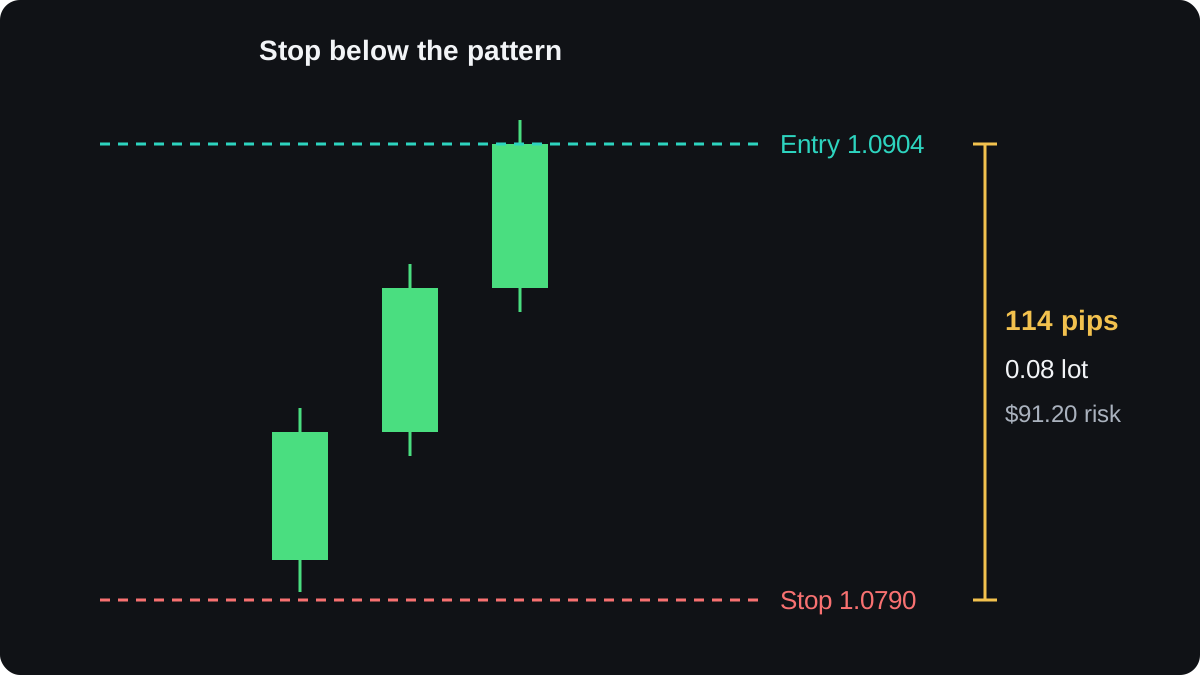
Say a trader buys the EUR/USD soldiers at the third close, 1.0904. The stop goes 2 pips below the pattern low of 1.0792, at 1.0790. The trader plans to risk $100 in a US dollar account.
- Stop distance: 1.0904 minus 1.0790 = 0.0114, which is 114 pips.
- Pip value allowed: $100 ÷ 114 = about $0.877 per pip.
- On EUR/USD, 0.01 lot is worth $0.10 per pip, so the largest size under that limit is 0.08 lot, worth $0.80 per pip.
- Loss if the stop is hit: 114 × $0.80 = $91.20, before spread and any commission.
With the same $100 and a 30-pip stop, the size could be 0.33 lot: $100 ÷ 30 = $3.33 per pip, rounded down to $3.30, so the loss at the stop would be 30 × $3.30 = $99.00.
A stop under the third candle's low, 1.0862, is a tighter choice at 1.0904 minus 1.0862 = 42 pips. The trade-off is that an ordinary pullback after a strong run can reach that level.
The position size lesson walks through this method for any pair, and the lot size calculator does the sums. The next pattern, three inside up and three inside down, is a slower three-candle reversal built around a smaller middle candle.
常見問題
Is three white soldiers bullish?
It is read as a bullish reversal signal when it follows a decline. It gives no guarantee, and after a long run up it can come just before a pullback.
How many candles are in three black crows?
Three bearish candles after a rise, each closing lower than the last and near its low. Classic definitions also expect each one to open inside the previous body.
What is the difference between three white soldiers and a morning star?
A morning star has a small middle candle between a long red candle and a long green one. Three white soldiers has three long green candles in a row, with no small candle in the middle.
Can three white soldiers fail?
Yes. Price can reverse soon after the third candle, especially when the bodies shrink, the upper wicks grow or the pattern runs straight into resistance.
Which timeframe is best for this pattern?
No timeframe makes it reliable. Daily and 4-hour candles cover more trading and are less affected by one burst of orders, but any rule still needs testing on your own data.
繼續學習
 第 2 章How to read a candlestick.A candlestick shows four prices for one trading period: the open, high, low and close. The thick body runs from open to close, and the thin wicks reach the high and the low. A candle that closed above its open is bullish, usually green, and one that closed below is bearish, usually red.
 第 2 章What candle bodies and wicks tell you.A candle's body shows the move from open to close, and its wicks show prices reached but not kept. A long body means price moved far and held it; a short body means open and close ended near each other. A long lower wick shows a drop bought back, and a long upper wick a rise sold off.
 第 2 章Spinning tops and marubozu candles.A spinning top is a candle with a small body and wicks on both sides longer than the body, showing that buyers and sellers ended the period roughly even. A marubozu is the opposite: a long body with little or no wick, showing one side controlled the period from open to close. Neither predicts the next move alone.
 第 2 章Doji candles and what they signal.A doji is a candle that opens and closes at almost the same price, so its body is a thin line. It shows buyers and sellers ended the period even. The four common types are standard, long-legged, dragonfly and gravestone. A doji alone is a weak signal; context and the next candle matter.
 第 2 章Hammer and hanging man patterns.A hammer and a hanging man are the same candle: a small body near the top and a lower wick at least twice as long. After a fall it is a hammer, a hint that selling may be fading. After a rise it is a hanging man, a warning that buying may be tiring. Each needs a confirming next candle.
 第 2 章Inverted hammer and shooting star patterns.An inverted hammer and a shooting star are the same candle: a small body near the low and a long upper wick, usually at least twice the body. After a fall it is an inverted hammer, a possible turn up. After a rise it is a shooting star, a possible turn down. Both need a confirming close.
 第 2 章Bullish and bearish engulfing patterns.An engulfing pattern is a two-candle reversal signal. A bullish engulfing forms after a decline, when a rising candle's body completely covers the previous falling candle's body. A bearish engulfing is the mirror image after a rise. It suggests control has switched sides, but it often fails in ranges and means more at a support or resistance level.
 第 2 章Tweezer tops and bottoms.A tweezer top is two candles, usually side by side, that reach almost the same high after a rise. A tweezer bottom is two candles with almost the same low after a fall. Both show a price the market rejected twice. They mean most at a known level and are weak signals on their own.
 第 2 章Morning star and evening star patterns.A morning star is a three-candle pattern at the end of a fall: a long bearish candle, a small-bodied star near the low, then a long bullish candle that closes above the first candle's midpoint. An evening star is the mirror image after a rise. Both suggest a possible reversal, and neither guarantees one.
 第 2 章Three inside up and three inside down.Three inside up is a three-candle bullish reversal pattern: a long bearish candle, a small bullish candle whose body sits inside it, then a bullish candle that closes above the first candle's open. Three inside down is the mirror image after a rise. Both are a harami plus a confirming candle, and neither is a reliable signal on its own.
 第 2 章Candlestick patterns cheat sheet.A candlestick pattern is a shape made by one, two or three candles that hints at who controlled price. Single candles such as the doji, hammer and shooting star show rejection or indecision. Two- and three-candle patterns such as engulfing and morning star show a shift. None predicts price reliably on its own.

