What are pivot points?
Pivot points are support and resistance levels calculated from the previous period's high, low and close. The main pivot, P, is the average of those three prices. Formulas built from P and the previous high and low then give resistance levels R1 to R3 above it and support levels S1 to S3 below it, fixed for the whole period.
本頁目前僅提供英文版。

Take yesterday's high, low and close on EUR/USD. With a few lines of arithmetic, those three prices give you a ladder of levels for today before the first trade of the session. Those levels are pivot points.
Traders treat them as ready-made support and resistance, prices where buying or selling may show up. Anyone using the same three prices gets the same levels, which is a large part of their appeal.
How is the pivot point calculated?
The central level is the pivot point, written P. It is the plain average of the previous period's high, low and close:
P = (High + Low + Close) ÷ 3
From P and the previous high and low, further formulas build three resistance levels above it, R1, R2 and R3, and three support levels below it, S1, S2 and S3.
R1 and S1 sit closest to P, and each higher number sits further out.
This version is usually called the standard or classic pivot. Fibonacci and Camarilla pivots use the same three inputs with different multipliers, and the next lesson compares them.
The method is often said to come from floor traders in futures pits, who wanted levels they could work out by hand before the open.
Working out a full set of levels on EUR/USD
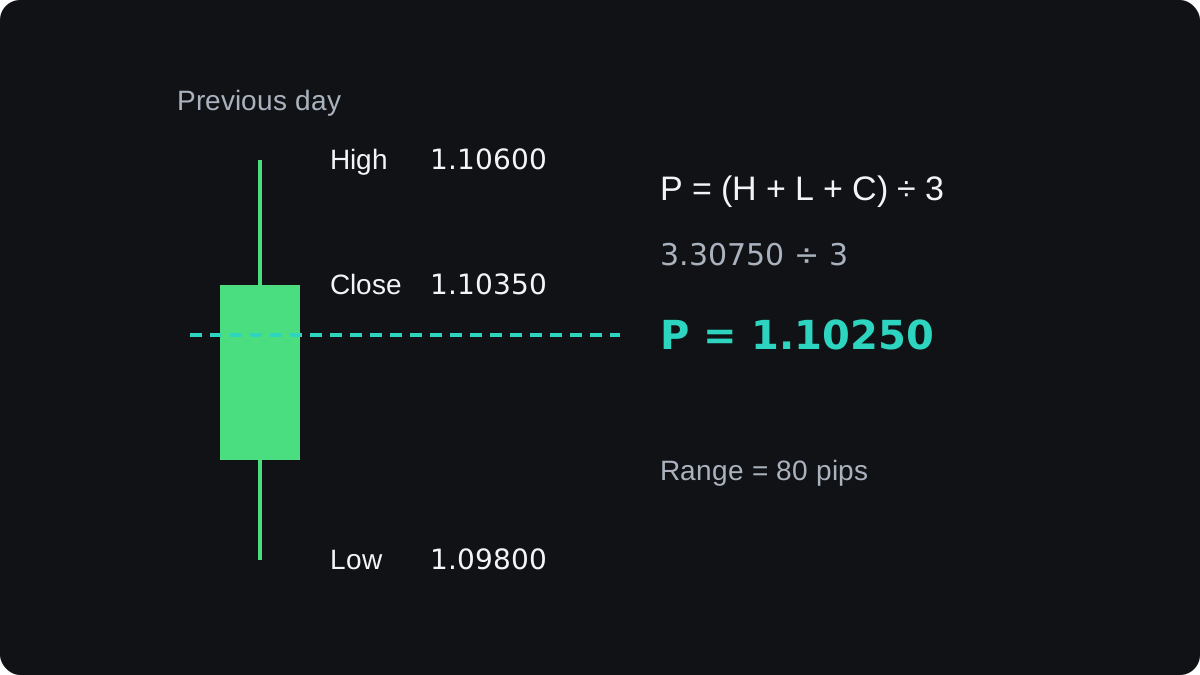
Say yesterday EUR/USD made a high of 1.10600, a low of 1.09800 and closed at 1.10350. These are round illustrative prices.
- Add the three prices: 1.10600 + 1.09800 + 1.10350 = 3.30750.
- Divide by three: 3.30750 ÷ 3 = 1.10250. That is P.
- Work out yesterday's range: 1.10600 − 1.09800 = 0.00800, which is 80 pips.
The other six levels come from P, the high, the low and the range:
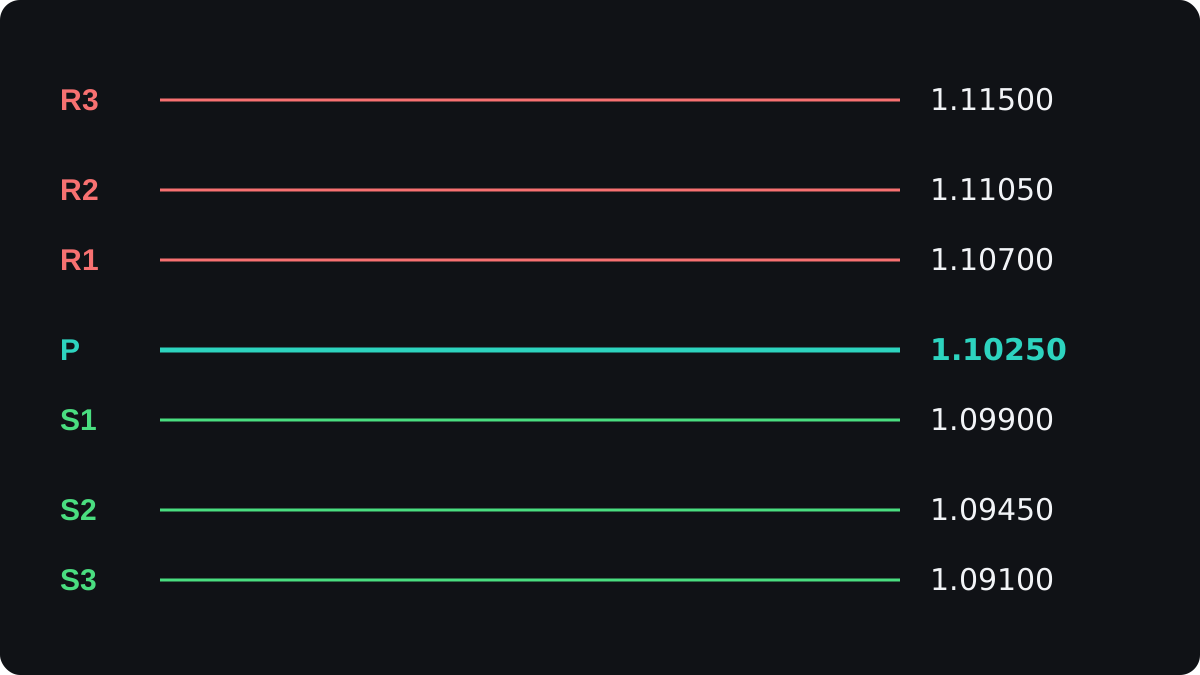
- R1 = 2 × 1.10250 − 1.09800 = 2.20500 − 1.09800 = 1.10700.
- S1 = 2 × 1.10250 − 1.10600 = 2.20500 − 1.10600 = 1.09900.
- R2 = 1.10250 + 0.00800 = 1.11050.
- S2 = 1.10250 − 0.00800 = 1.09450.
- R3 = 1.10600 + 2 × (1.10250 − 1.09800) = 1.10600 + 0.00900 = 1.11500.
- S3 = 1.09800 − 2 × (1.10600 − 1.10250) = 1.09800 − 0.00700 = 1.09100.
| Level | Formula | EUR/USD | Distance from P |
|---|---|---|---|
| R3 | High + 2 × (P − Low) | 1.11500 | +125 pips |
| R2 | P + (High − Low) | 1.11050 | +80 pips |
| R1 | 2 × P − Low | 1.10700 | +45 pips |
| P | (High + Low + Close) ÷ 3 | 1.10250 | 0 |
| S1 | 2 × P − High | 1.09900 | −35 pips |
| S2 | P − (High − Low) | 1.09450 | −80 pips |
| S3 | Low − 2 × (High − P) | 1.09100 | −115 pips |
The levels are unevenly spaced. R1 is as far above P as yesterday's low was below it, 45 pips, and S1 is as far below P as yesterday's high was above it, 35 pips.
A close near the top of yesterday's range lifts P, and every other level moves up with it.
Yen pairs follow the same steps, but a pip there is 0.01. Suppose USD/JPY made a high of 151.20, a low of 149.90 and closed at 150.70.
Then P = 451.80 ÷ 3 = 150.60, R1 = 301.20 − 149.90 = 151.30 and S1 = 301.20 − 151.20 = 150.00. R1 sits 70 pips above P and S1 sits 60 pips below it.
The pivot point calculator runs these sums for any pair, so you can check your own figures against it.
Which high, low and close go into the formula?
The period you feed in decides the period the levels cover. Yesterday's prices give daily pivots for today. Last week's prices give weekly pivots, and last month's give monthly pivots.
A longer period usually has a wider range, so its levels sit further apart. In the example above, neighbouring daily levels were 35 to 45 pips apart, while monthly levels can be hundreds of pips apart.
Forex trades around the clock on weekdays, so there is no single closing bell. Your daily high, low and close depend on when your chart's daily candle starts and ends.
A widely used convention ends the forex day at 17:00 New York time. Some brokers set their server clock so the daily candle closes then, while others use a different cut-off and get different candles, and so different pivots.
The Sunday candle is a related trap. If the market reopens on Sunday evening in your chart's time zone, a midnight cut-off gives a Sunday candle of only a few hours, and Monday's pivots built from it can mislead you.
Once the period closes, the levels stay fixed until the next one. They do not shift with each new candle the way a moving average does.
How do traders read the levels?
Most uses of pivots are conventions, habits that many chart readers share. None of them is a rule the market has to follow.
- Price trading above P is often read as a lean toward buyers for the day, and price below P as a lean toward sellers.
- R1 and S1 are watched for a stall or a reversal, like any other support or resistance. Treat each as a zone a few pips wide, since price rarely turns at the exact digit.
- A level can mark a target or a place for a stop loss. A buyer near S1 might aim for P and put the stop below S2, which is an example of the logic and nothing more.
- A clean break through R1 or S1 shifts attention to the next level out.
The same level can lead to either outcome. In the left panel below, price climbs from P, pokes 2 pips above R1 and falls back. In the right panel, it pushes through R1 and keeps rising.
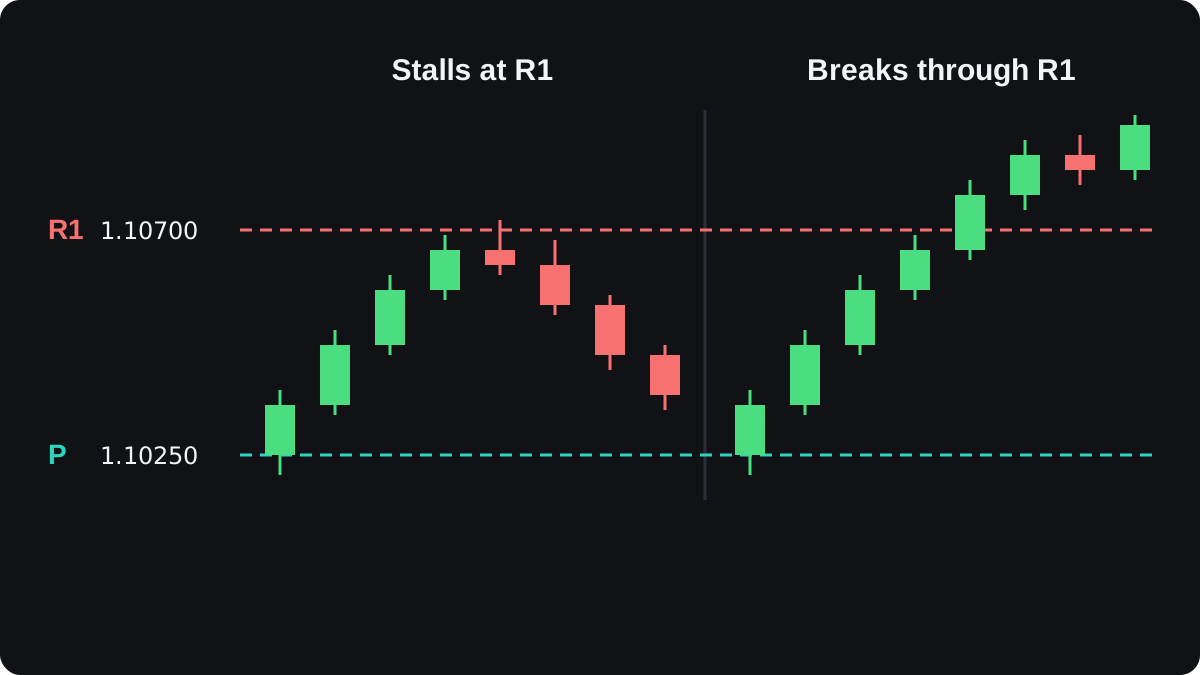
Nothing in the formula tells you in advance which of those two days you are having. The lesson on trading with pivot points looks at setups for both cases and how traders try to tell them apart.
Where do pivot points fall short?
Pivots use three prices from the last period and nothing else. They know nothing about today's news or the direction of the longer trend.
The usual argument for them is that they are self-fulfilling: if enough traders watch the same levels, orders gather there. That is plausible, but solid public evidence that pivot levels hold more often than randomly picked levels is limited.
With seven daily levels, plus weekly and monthly sets, price is almost always near some pivot. That makes it easy to spot a bounce after the fact and easy to forget the levels price ignored.
On days with major economic releases, price can travel through several levels in minutes. A level that held on quieter days offers no protection when the news surprises the market.
Different data and different formulas also give different ladders. Before you compare your levels with anyone else's, confirm that both use the same high, low, close and method.
常見問題
What is the formula for a pivot point?
The standard pivot is P = (High + Low + Close) ÷ 3, using the previous period's prices. R1 is 2 × P minus the low, and S1 is 2 × P minus the high.
Do pivot points work in forex?
They give you objective levels to watch, and price sometimes reacts near them. Price also often runs straight through them, and evidence that they beat randomly chosen levels is limited, so treat them as reference points.
Which charts are daily pivots used on?
Daily pivots cover one day, so they are usually paired with intraday charts such as 5 minute to 1 hour. Traders who hold positions for days tend to look at weekly or monthly pivots.
Why are my pivot points different from another website's?
The two sources probably build their daily candles with different cut-off times, or use a different formula such as Fibonacci or Camarilla. Check which high, low and close each one uses.
Are pivot points a leading indicator?
Partly. They are calculated from past prices, but the levels are known before the period starts and do not change during it.
繼續學習
 第 3 章Standard, Fibonacci and Camarilla pivots.All three methods use the previous day's high, low and close. Standard pivots set P = (H + L + C) ÷ 3 and build levels from P and the range. Fibonacci pivots place levels 38.2%, 61.8% and 100% of the range either side of P. Camarilla pivots cluster tightly around the close using the constant 1.1.
 第 3 章How to trade with pivot points.Pivot points give two common trade setups. In a range, traders buy near S1 or sell near R1 and target the central pivot. On a breakout, they trade a candle close through R1 or S1 toward R2 or S2. In both, the stop sits just beyond the level, so a failed level costs a small, planned loss.
 第 3 章Pivot points cheat sheet.A pivot point is the average of the previous period's high, low and close: P = (H + L + C) ÷ 3. Standard levels come from P and the range, Fibonacci pivots sit 38.2%, 61.8% and 100% of the range from P, and Camarilla levels sit near the previous close. None predicts where price will turn.

