What is risk management in trading?
Risk management is the set of rules, decided before you place an order, that limits how much you can lose on one trade and in total. It covers risk per trade, stop placement, position size and total exposure. Its job is keeping you trading through losing streaks, because no method wins every trade.
本頁目前僅提供英文版。

Two traders each start with $10,000 and take the same five losing trades in a row. One ends with $9,039. The other ends with $3,277.
Both made the same trades. The only difference was how much each trader put at risk on every trade, and that choice is the core of risk management.
What does risk management mean in trading?
Risk management is the set of rules you decide before a trade about how much money you are willing to lose, and how you keep each loss to that amount. It also caps losses across all open trades and over a day or a week.
Every trading method has losing trades. Analysis helps you choose where to enter. Risk management decides whether a run of bad trades leaves you with an account still worth trading.
A complete plan answers these questions before you click buy or sell:
- What share of the account can this one trade lose?
- Where does the stop loss go, so the trade closes if your idea proves wrong?
- What position size makes a hit stop cost exactly that amount?
- How much is at risk across all open trades together?
- At what loss for the day or week do you stop and review?
Why does a loss hurt more than a gain helps?
Say your account falls from $10,000 to $9,000, a 10% loss. To get back to $10,000 you need $1,000 on a $9,000 balance, which is a gain of 11.1%.
The gap widens quickly. A 50% loss leaves $5,000, and getting from $5,000 back to $10,000 needs a 100% gain.
The formula is: gain needed = loss ÷ (100% minus loss). For a 20% loss that is 20 ÷ 80 = 25%. For a 30% loss it is 30 ÷ 70 = 42.9%.
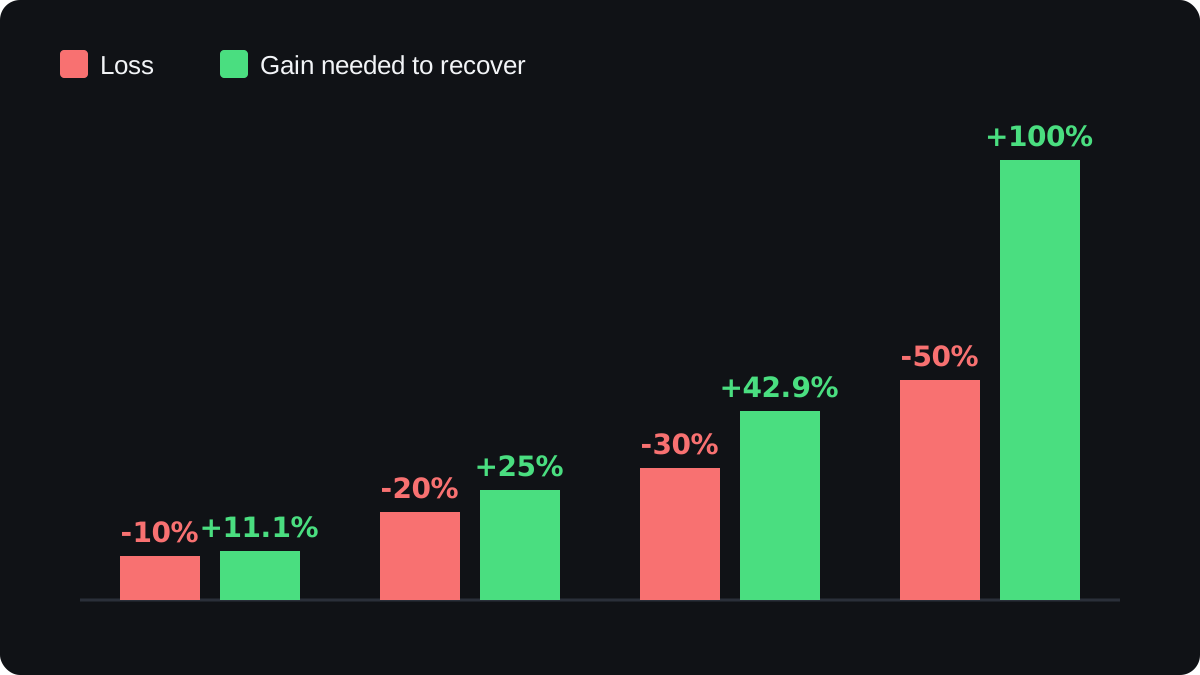
A small loss takes a small gain to repair, and a large one takes a far larger gain. The drawdown lesson works through this recovery maths in more detail.
Same trades, different risk: a five-loss streak
Back to the two traders. Trader A risks 2% of the current balance on each trade. Trader B risks 20%. Both lose five trades in a row, with round illustrative numbers:
| After | Trader A (2%) | Trader B (20%) |
|---|---|---|
| Start | $10,000.00 | $10,000.00 |
| Loss 1 | $9,800.00 | $8,000.00 |
| Loss 2 | $9,604.00 | $6,400.00 |
| Loss 3 | $9,411.92 | $5,120.00 |
| Loss 4 | $9,223.68 | $4,096.00 |
| Loss 5 | $9,039.21 | $3,276.80 |
Trader A is down 9.6% and needs a gain of about 10.6% to recover. Trader B is down 67.2% and needs about 205%, more than tripling what is left.
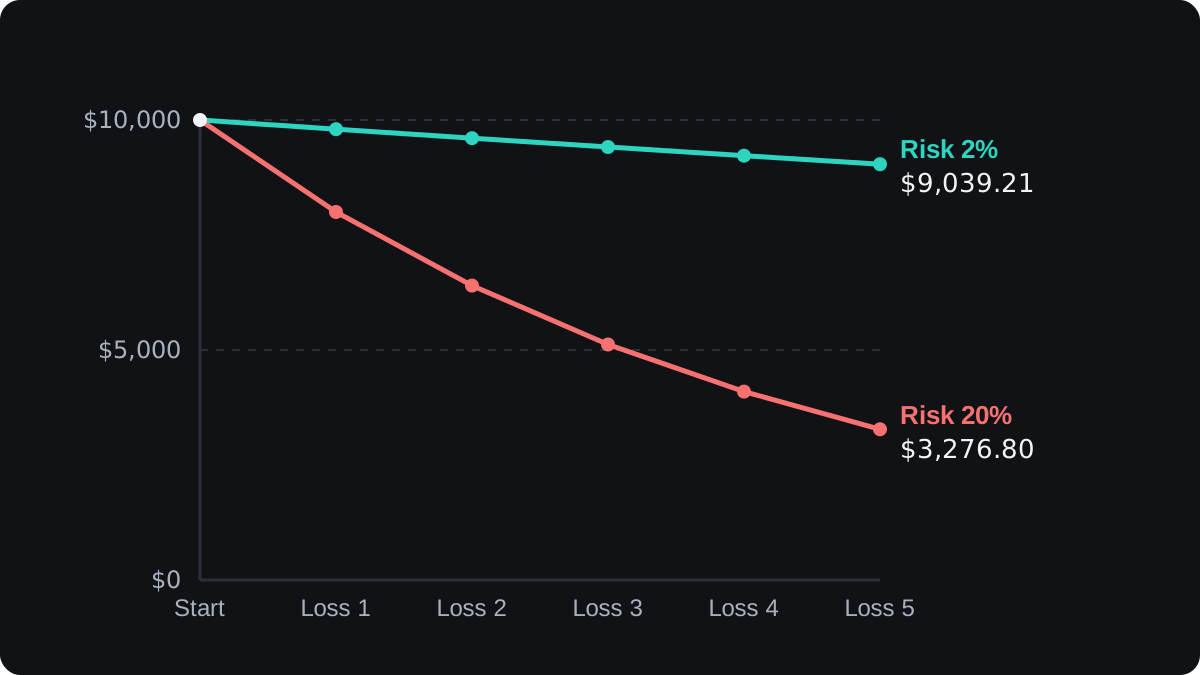
Five losses in a row is an ordinary event.
If each trade had an even chance of winning, any given run of five trades would all lose with a 1 in 32 chance, and over a few hundred trades a streak that long is very likely to appear somewhere.
Risking a percentage of the current balance also makes each loss smaller in money as the account falls. Trader A's fifth loss cost $184.47, compared with $200.00 for the first.
How do you turn a risk limit into a trade size?
A percentage limit only protects you if the trade size matches it. You start from your risk in money and the distance to your stop, then convert with the pair's pip value.
A worked example on EUR/USD in a US dollar account, with illustrative numbers:
- The account holds $10,000 and you risk 1%, so the most this trade may lose is $100.
- The chart puts your stop 50 pips from the entry.
- $100 ÷ 50 pips = $2.00 per pip.
- One standard lot of EUR/USD is worth $10 per pip, so $2.00 ÷ $10 = 0.20 lot.
- Check: 0.20 lot × $10 × 50 pips = $100.
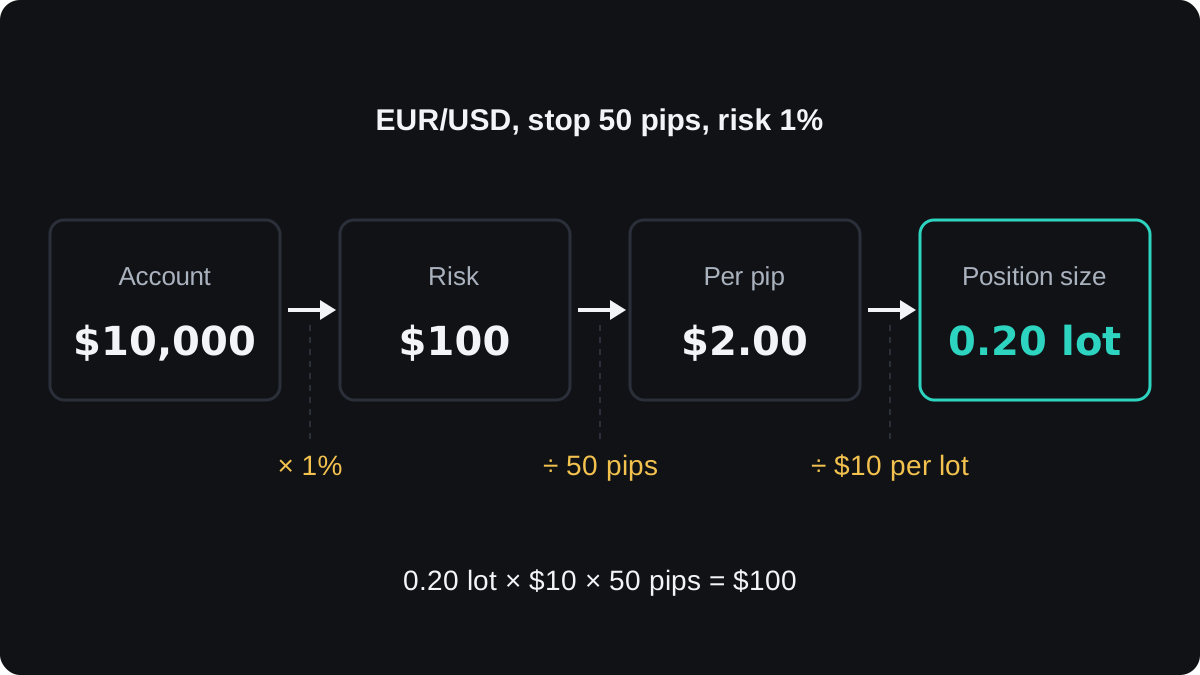
If the chart says the stop needs 100 pips instead, the same $100 allows only 0.10 lot. The stop distance comes from the chart, and the size follows from it.
The position size lesson covers other pairs and account currencies, and the lot size calculator does the arithmetic. Choosing the percentage itself is the subject of how much to risk per trade.
Why a high win rate can still lose money
Take ten trades with six winners. Six wins of $50 make $300, and four losses of $100 cost $400, so the account is $100 down before costs despite a 60% win rate.
Now change the sizes. Four wins of $150 make $600, six losses of $50 cost $300, and the account gains $300 with only a 40% win rate.
The result depends on the average win times how often you win, minus the average loss times how often you lose.
Holding losses to a planned stop is the part of that sum you control most directly, and the risk-reward lesson shows how the two sides trade off.
Where risk management falls short
A standard stop loss is an order, and its fill price is not guaranteed. In a fast market or over a weekend gap, price can jump past your stop and the loss ends up larger than planned. The slippage lesson explains how that happens.
Your planned $100 also leaves out some costs. Commission, and swap on positions held overnight, come on top of it.
Separate trades can be one bet. Buying EUR/USD and GBP/USD at 1% each can mean close to 2% lost on a single rise in the US dollar, because the two pairs often move in the same direction. Currency correlation measures how closely pairs move together.
Risk management cannot turn a losing method into a winning one. If your trades lose money on average after costs, small sizes only make the losses arrive more slowly.
The 1 to 2% per trade guideline you will often see is a rule of thumb. It keeps a long losing streak survivable, but there is no single correct number that suits every trader.
常見問題
What is the 1% rule in trading?
It means losing no more than 1% of your account if a trade hits its stop, so on $10,000 the most one trade can cost is $100. Position size is then worked out from that amount and the stop distance.
Is a stop loss enough risk management?
A stop limits one trade only when the position size matches it. You still need to cap total risk across open trades, and a stop can fill at a worse price in a gap.
How do traders blow up their accounts?
An account is wiped out when single losses are allowed to grow large, through oversized trades, missing stops or adding to losing positions. An ordinary losing streak can then take most of the balance.
Does risk management guarantee profits?
No. It limits how much you lose when you are wrong, and profit still depends on whether your method makes money on average after costs.
繼續學習
 第 1 章Drawdown and the maths of recovery.A drawdown is the fall in your account from its highest point to a later low, shown as a percentage. Losses and gains are not symmetric: after losing 50% you need a 100% gain to break even, because the gain is earned on a smaller balance. The gain needed is the loss divided by one minus the loss.
 第 1 章How much to risk per trade.Risk per trade is the money you lose if a trade hits its stop loss. The fixed-percentage rule sets it as a share of your current balance, commonly 1% to 2%, so each loss shrinks the next bet. At 1%, ten losses in a row take a $10,000 account to about $9,044.
 第 1 章Risk-reward ratio and win rate.The risk-reward ratio compares what a trade can lose with what it aims to win, and the win rate is the share of trades that win. Together they decide whether a strategy pays. The win rate you need to break even is risk divided by risk plus reward, so a 1:2 trade needs 33.3% before costs.

