What is fundamental analysis?
Fundamental analysis judges a currency by the economy behind it: interest rates, inflation, growth, jobs and government policy. In forex it always compares two economies, because a pair prices one currency in another. Prices react most to surprises against forecasts, and the method is better at explaining direction over months than at timing trades.
Ce contenu n'existe pour l'instant qu'en anglais.

Two charts can look the same and still tell different stories. A chart reader studies the shape of the price. A fundamental analyst asks what is happening in the economies behind the two currencies, and whether that should make one of them worth more.
If you have just read what technical analysis is, this lesson covers the other side: the reasons a price might move.
What does fundamental analysis study?
Picture two countries. One has rising wages, steady growth and a central bank that keeps raising interest rates.
The other has a shrinking economy and a central bank cutting rates. Over time, investors tend to prefer holding the first country's currency.
Fundamental analysis is the study of the economic and political forces behind a currency's value. In forex it always compares two economies, because a currency pair is one currency priced in another.
The usual inputs are:
- Interest rates, set by each central bank.
- Inflation, usually measured by a consumer price index (CPI).
- Growth, measured by gross domestic product (GDP).
- Jobs data, such as the unemployment rate.
- Trade balances, government budgets and politics.
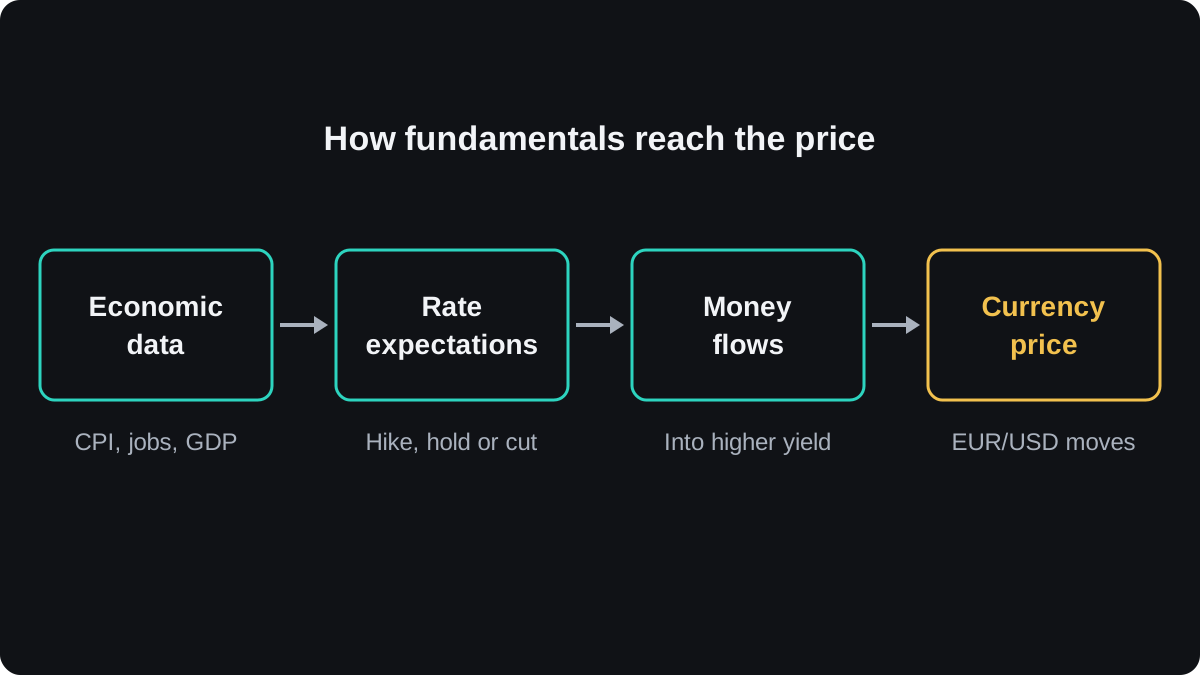
These inputs rarely move a currency on their own. They change what traders expect the central bank to do next, and that expectation changes where money wants to sit.
Why do interest rates matter so much?
Money tends to flow where it earns more, other things being equal. If deposits in one currency pay more interest than deposits in another, holding the first currency becomes more attractive.
Here is a worked example with illustrative rates. They are round numbers chosen for the arithmetic, not current rates.
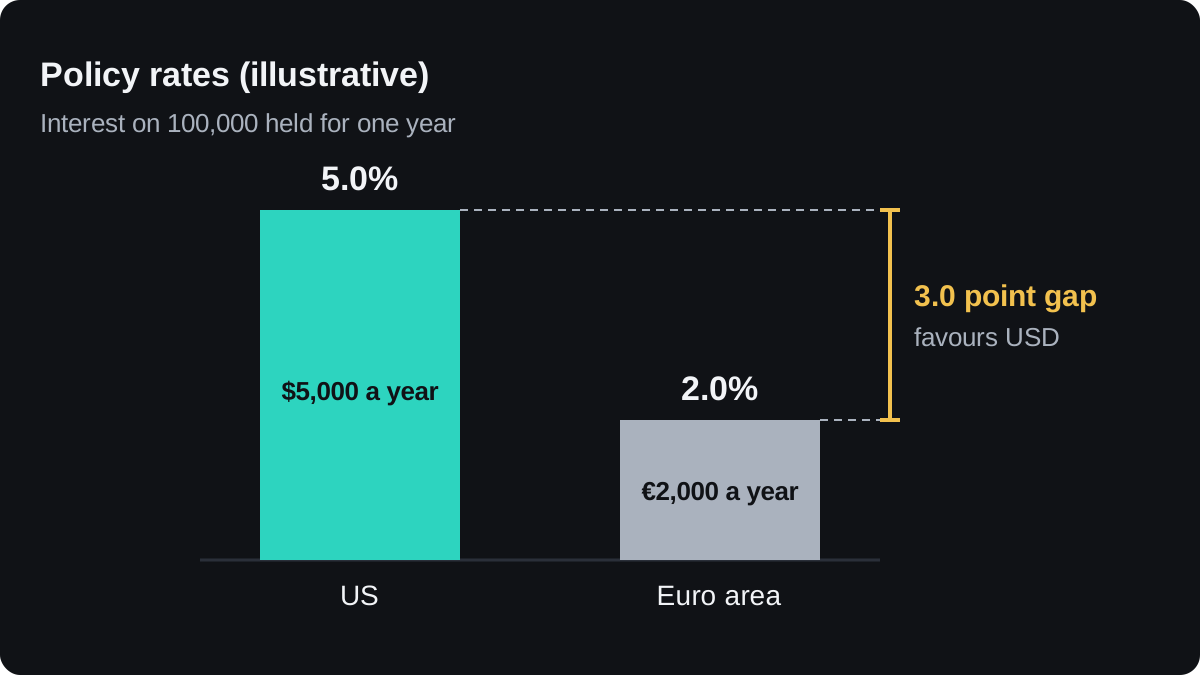
- The US policy rate is 5.0% and the euro area rate is 2.0%.
- $100,000 at 5.0% earns 100,000 × 0.05 = $5,000 in a year.
- €100,000 at 2.0% earns 100,000 × 0.02 = €2,000 in a year.
- The gap is 5.0 − 2.0 = 3.0 percentage points. Each year the dollar deposit earns 3 more per 100 held, each side counted in its own currency.
That gap is the interest rate differential. When it widens in a currency's favour, demand for that currency tends to rise. When markets expect it to shrink, the currency often weakens before any rate actually changes.
Central banks move rates to manage inflation and growth, so traders follow every meeting and speech. The lessons on interest rates and currencies and how central banks move currencies go deeper.
How do inflation, growth and jobs fit in?
Each data release is a clue about the next rate decision. A fundamental analyst reads the numbers through that lens.
- Inflation above the central bank's target makes a rate rise more likely, which can support the currency in the short run.
- Over many years, high inflation erodes what the currency buys, which works against it.
- Strong growth and low unemployment give a central bank room to keep rates high.
- Weak growth or rising unemployment push toward rate cuts.
So the same inflation number can help a currency this month and hurt it over a decade. Deciding which effect the market cares about right now is where the judgement comes in.
Why do surprises move prices more than the news?
Markets look ahead. Before a release, economists publish a forecast, and prices already reflect it. What moves the market is the gap between the forecast and the actual number.
A worked example, with illustrative prices:
- EUR/USD trades at 1.10000 before a US inflation release.
- The forecast for yearly CPI is 3.0%. The actual reading is 3.4%.
- In this example, traders now expect US rates to stay higher for longer. They buy dollars, and EUR/USD falls to 1.09400.
- The move is 1.10000 − 1.09400 = 0.00600, which is 60 pips.
- On 0.10 lot, which is 10,000 euros, one pip is 10,000 × 0.0001 = $1. The move is worth 60 × $1 = $60.
- A short position of that size gains $60, and a long position of that size loses $60.
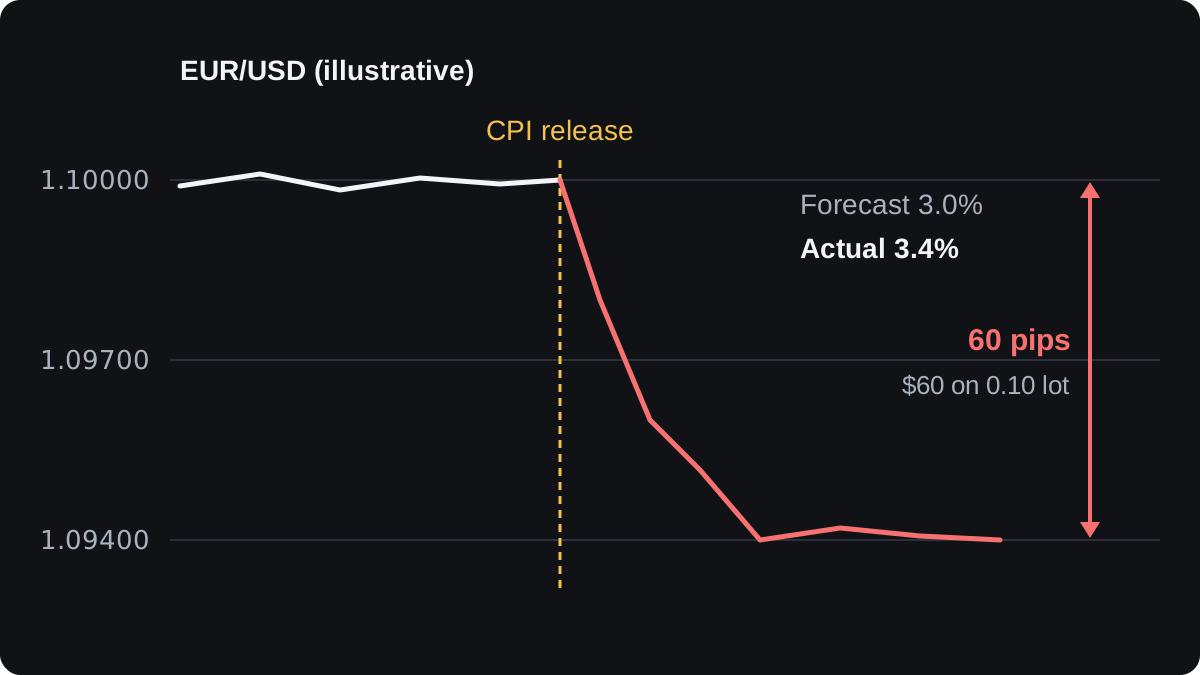
Had the reading come in at exactly 3.0%, the price might have barely moved, because the market learned nothing new. The reaction can also reverse within minutes as traders read the details behind the headline.
An economic calendar lists scheduled releases with the forecast and the previous reading. The lesson on expectations versus actual shows how to judge the size of a surprise.
How do you compare two economies?
A pair has two sides, so you score both. The snapshot below is made up for illustration:
| Factor | United States | Euro area |
|---|---|---|
| Policy rate | 5.0% | 2.0% |
| Inflation, yearly | 3.4% | 2.2% |
| GDP growth, yearly | 2.5% | 0.8% |
| Next central bank move expected | Hold | Cut |
The rate, growth and expected-move rows lean toward the dollar. An analyst who reads it that way would expect a lower EUR/USD over the coming months, meaning a weaker euro against the dollar.
The inflation row is mixed. Higher US inflation keeps the US central bank from cutting, which supports the dollar now, but if it lasts for years it erodes what a dollar buys.
Real snapshots usually have more rows pulling in different directions, and you have to decide which ones the central banks will weigh more. The lesson on building a fundamental view walks through that process with more factors.
Where does fundamental analysis fall short?
The first problem is timing. A view can be right about direction over months and still be early by weeks. Price can move against you long enough to reach your stop loss before the economy catches up.
The second is that news is often priced in. If everyone expects a rate rise, the currency may have climbed already. When the rise is announced, the price can fall as traders take profit.
Signals also conflict. Growth, inflation and politics often disagree, and two careful analysts can reach opposite views from the same data.
Sudden events can override months of data in a day. An election result or a central bank buying its own currency in the market can do that.
The evidence on forecasting is humbling. In a well-known 1983 study, economists Richard Meese and Kenneth Rogoff found that standard exchange rate models forecast no better over the following months than simply assuming no change.
Some later studies found more forecasting power over horizons of several years, though results vary, and short-term forecasting from economic data remains weak.
One common approach is to use fundamentals for direction and charts for timing, though that mix has no proof of success either. The next lesson, on sentiment analysis, adds a third angle: how other traders are already positioned.
Questions fréquentes
Is fundamental analysis better than technical analysis?
Neither has been shown to be better for everyone. Fundamentals help explain why a currency might move over months, and charts help with when to enter and exit, so the two are often used together.
What matters most in forex fundamental analysis?
Interest rates and expectations about them usually have the strongest pull, because they change what holding a currency earns. Inflation and jobs data matter largely because they shift those expectations.
Can you trade forex using only fundamental analysis?
Some longer-term traders do, holding positions for weeks or months. Timing is the hard part, so they still need a stop loss and a position size that can survive the price moving against them first.
Why did a currency fall after good news?
The good news was often expected and already priced in, or the details were weaker than the headline. Prices react to the surprise against the forecast.
Where can I find economic data releases?
An economic calendar lists scheduled releases with the forecast, the previous reading and the actual number once published. Central banks publish their decisions and meeting dates on their own websites.
Continuer à apprendre
 Chapitre 2The three ways to analyse the forex market.Forex traders analyse the market in three ways. Technical analysis reads price charts to ask what price has done. Fundamental analysis reads economic data and interest rates to ask why a currency might move. Sentiment analysis reads trader positioning to ask how the crowd is leaning. Each answers a different question and fails in its own way.
 Chapitre 2What is technical analysis?Technical analysis is the study of past price movements, usually on a chart, to judge which way price may move next and to plan entries and exits. Traders look for trends, support and resistance levels, patterns and indicators. It helps with timing and risk planning, but it cannot predict price reliably.
 Chapitre 2What is sentiment analysis in forex?Sentiment analysis measures how other traders are positioned, such as the share of a broker's clients who are long or short a pair, or speculators' net futures positions in the weekly COT report. It is often read as a contrarian signal, because a crowded trade can unwind, but positioning says little about timing.
 Chapitre 2Technical, fundamental or sentiment: which should you use?No single approach is best. Fundamental analysis suggests which way a currency should drift, sentiment shows whether that view is already crowded, and technical analysis sets the entry, stop and target. You can use all three in that order, from the slow view to the fast one, and keep each chart to one tool per question.
Courtiers partenaires

