What is sentiment analysis in forex?
Sentiment analysis measures how other traders are positioned, such as the share of a broker's clients who are long or short a pair, or speculators' net futures positions in the weekly COT report. It is often read as a contrarian signal, because a crowded trade can unwind, but positioning says little about timing.
Ce contenu n'existe pour l'instant qu'en anglais.

Suppose a broker reports that 72% of its clients holding EUR/USD are long. That number says nothing about the euro area economy or the shape of the chart. It tells you what other traders have already done with their money.
Sentiment analysis studies that kind of number. It is the third of the three ways to analyse the market, next to technical analysis and fundamental analysis, and it asks who is already in the trade.
What does sentiment mean in forex?
Sentiment analysis is the study of how other traders are positioned: which way they lean on a pair and how heavily. A long position gains if the price rises, and a short position gains if it falls.
A sentiment reading describes the present. The analysis comes next, when you ask what those open positions could force traders to do later.
Every open trade is closed one day, and closing a long means selling. If nearly every trader in a group is already long, that group has few buyers left to push the price higher and many sellers waiting to close.
This is why sentiment is often read the contrarian way, against the crowd.
Where does sentiment data come from?
Retail positioning
Some brokers and trading-data sites publish the share of their clients who are long or short each pair. The data comes from real accounts, but only from that firm's customers, so it is a sample of retail traders.
The COT report
The US Commodity Futures Trading Commission (CFTC) publishes the Commitments of Traders report, the COT, each week. It shows who holds positions in US futures markets, including the euro and yen contracts.
The figures describe positions as of Tuesday and are usually released on Friday. A common reading uses the non-commercial group, which is mostly speculators such as hedge funds. The COT report lesson covers how to read it.
Risk mood
Some signals measure appetite for risk across all markets. Falling stock markets and a rising VIX, an index of expected volatility in US shares, are often read as fear, a mood described in the lesson on risk-on and risk-off.
Reading retail positioning: a worked example
The numbers in this example are illustrative. Say one broker shows these figures for EUR/USD:
- Clients long: 72% of open positions.
- Clients short: 28% of open positions.
- Long to short ratio: 72 ÷ 28 = 2.57, so there are about 2.57 long positions for every short one.
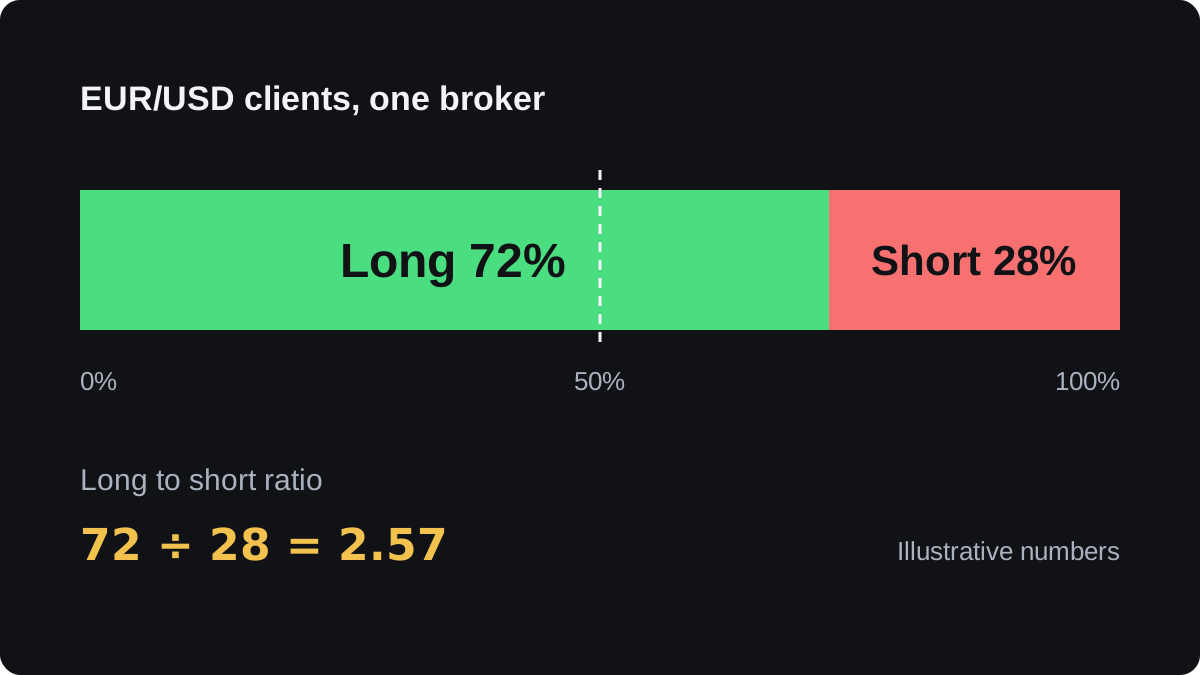
A contrarian reads a crowd this one-sided as a reason for caution about buying. The level alone is half the picture, though. How the share changed, and what the price did meanwhile, tells you more.
Suppose on Monday the split was 50% long with EUR/USD at 1.1000. By Friday it is 72% long with the price at 1.0900. The fall is 1.1000 − 1.0900 = 0.0100, which is 100 pips.
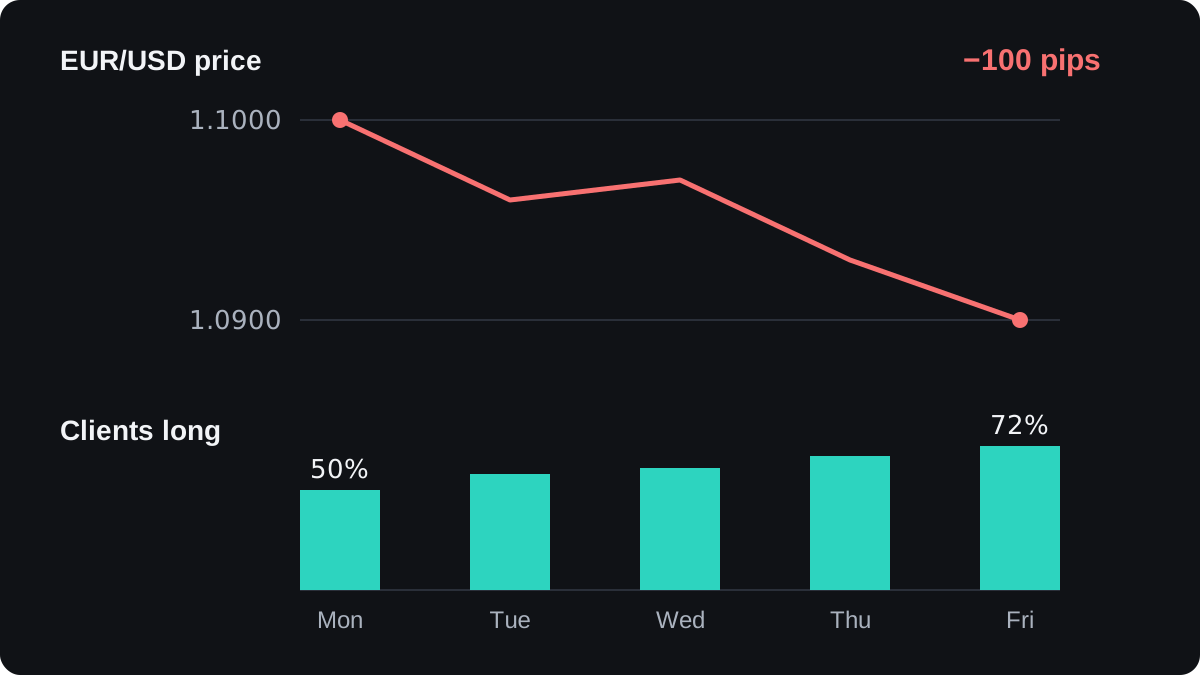
The crowd bought more as the price fell. A trader who bought one standard lot at 1.1000 is now down 100 pips, and at $10 per pip on EUR/USD that is a floating loss of 100 × $10 = $1,000 before costs.
If the price keeps falling, some of these traders hit their stop losses or run short of margin. Each forced exit from a long is a sell order, and those sales can push the price lower still.
Reading the COT report: a worked example
Again the figures are illustrative. Say the latest report shows non-commercial traders in euro futures holding 180,000 long contracts and 60,000 short contracts.
- Net position: 180,000 − 60,000 = +120,000 contracts, a net long.
- Over the past year the net position ranged from −40,000 to +130,000.
- Width of that range: 130,000 − (−40,000) = 170,000.
- Distance above the low: 120,000 − (−40,000) = 160,000.
- Position in the range: 160,000 ÷ 170,000 = 0.94, or 94%.
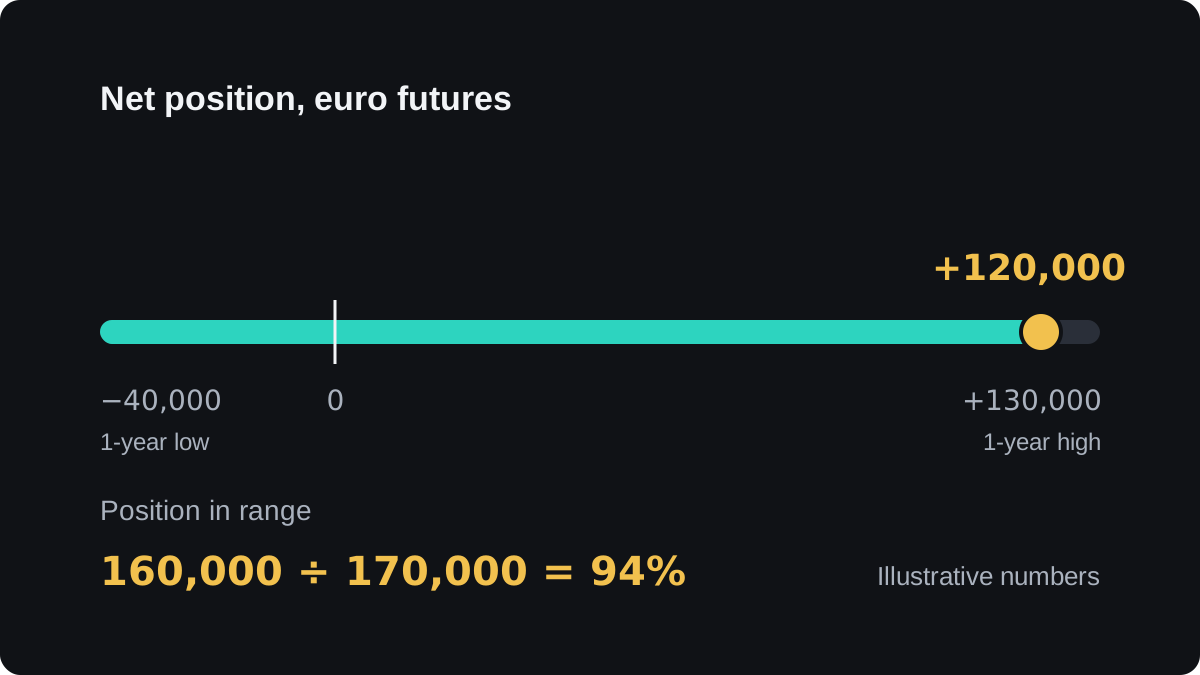
A reading near the top of its own range is often called crowded or stretched. Speculators have already bought much of what they planned to, so fresh buyers may be harder to find.
Compare a contract with its own history. Each futures market has its own normal size, so +120,000 in euro futures cannot be judged against a number from the yen contract.
Why is the crowd often late?
Speculators who follow trends tend to add to positions as a move goes on. Their net position is then often largest after much of the move has already happened.
Retail data often shows the opposite habit, as in the EUR/USD example: the share of longs rises while the pair falls. Buying a dip can feel like a bargain, and closing a losing trade can feel like admitting a mistake.
Behavioural finance calls the habit of selling winners too early and holding losers too long the disposition effect. Studies of stock investors have found it, and it is a plausible reason retail traders end up against a trend.
Late does not mean wrong at every moment. A crowded trade can keep paying for weeks before it turns.
Where does sentiment analysis fail?
Sentiment can suggest who might be on the wrong side. It says little about when the turn will come, and an extreme reading can grow more extreme while the price keeps moving.
The data is partial. One broker's clients are a small slice of retail trading, and exchange-traded futures are a small part of total forex turnover, most of which happens over the counter.
COT figures are also three days old when published, since Tuesday's positions appear on Friday.
Some futures positions are hedges. A fund that owns European shares may sell euro futures to protect their dollar value, which looks bearish in the data without being a forecast.
Evidence for contrarian rules is thin. Published tests are limited, and results depend on the period, the pair and the data source, so treat any claim that crowd data reliably predicts reversals with caution. The retail positioning lesson goes further.
How does sentiment fit with charts and fundamentals?
Sentiment is rarely used alone. A more common approach is to form an idea from the chart or the economy, then check how other traders are positioned before acting on it.
Say a chart shows EUR/USD breaking below support while the retail crowd is 72% long. The crowd sits against the move and may have to sell, so the two readings point the same way. This illustrates the reasoning only and is no recommendation to trade.
If the crowd were already heavily short at that break, the same move might have fewer forced sellers left to drive it. The next lesson compares the three approaches: which analysis to use.
Questions fréquentes
Is retail sentiment a contrarian indicator?
It is often read that way: when most clients are long, contrarians lean towards a fall. The evidence is mixed and the timing is poor, so treat it as one input among several.
When is the COT report released?
The CFTC usually releases it weekly on Friday, showing positions as of the Tuesday before. Public holidays can shift the date.
Where can I find forex sentiment data?
Some brokers show client positioning on their platforms or websites, and some trading-data sites gather it. The COT report is free on the CFTC website.
Is sentiment analysis useful for day trading?
The COT report is weekly, so it suits longer trades. Retail positioning updates more often, but it is still a slow signal for trades that last minutes or hours.
Continuer à apprendre
 Chapitre 2The three ways to analyse the forex market.Forex traders analyse the market in three ways. Technical analysis reads price charts to ask what price has done. Fundamental analysis reads economic data and interest rates to ask why a currency might move. Sentiment analysis reads trader positioning to ask how the crowd is leaning. Each answers a different question and fails in its own way.
 Chapitre 2What is technical analysis?Technical analysis is the study of past price movements, usually on a chart, to judge which way price may move next and to plan entries and exits. Traders look for trends, support and resistance levels, patterns and indicators. It helps with timing and risk planning, but it cannot predict price reliably.
 Chapitre 2What is fundamental analysis?Fundamental analysis judges a currency by the economy behind it: interest rates, inflation, growth, jobs and government policy. In forex it always compares two economies, because a pair prices one currency in another. Prices react most to surprises against forecasts, and the method is better at explaining direction over months than at timing trades.
 Chapitre 2Technical, fundamental or sentiment: which should you use?No single approach is best. Fundamental analysis suggests which way a currency should drift, sentiment shows whether that view is already crowded, and technical analysis sets the entry, stop and target. You can use all three in that order, from the slow view to the fast one, and keep each chart to one tool per question.
Courtiers partenaires

