Risk-on and risk-off.
Risk-on is a market mood where investors buy shares, commodities and higher-yielding currencies such as the Australian dollar. Risk-off is the opposite: fear rises and money moves toward safe havens, mainly the Japanese yen, the Swiss franc and often the US dollar. The pattern is a tendency, and interest rates or local news can break it.
Konten ini baru tersedia dalam bahasa Inggris.

On a calm day with rising stock markets, the Australian dollar often climbs while the Japanese yen slips. When a shock hits and shares fall hard, those moves can flip within hours.
Traders call these two moods risk-on and risk-off. Knowing which currencies tend to sit on each side helps you understand moves that have nothing to do with a single country's news.
What do risk-on and risk-off mean?
Risk-on describes a market where investors feel confident. They buy assets that can pay more but can also fall further, such as shares, commodities and higher-yielding currencies.
Risk-off is the reverse. Fear rises, investors sell those assets and move money toward things they expect to hold value, such as the government bonds of large economies and a small group of currencies.
The labels describe a pattern in how prices move together. Nobody announces the switch, so the mood is read from prices, usually after the move has started.
Typical triggers for risk-off are a banking scare, a war, a sharp sell-off in shares or fear of a recession. Risk-on often follows strong economic data, easier central bank policy or a crisis that turns out smaller than feared.
Which currencies are seen as safe havens?
A safe-haven currency is one that tends to hold its value or rise when markets are under stress. The Japanese yen and the Swiss franc fit this pattern most often, and the US dollar fits it in many episodes.
Japan has long held large investments abroad. One common explanation for the yen's behaviour is that in a panic some Japanese investors bring money home, which means buying yen. The yen profile covers this in more depth.
The yen has also been a popular funding currency for the carry trade: traders borrow in a low-rate currency to buy a higher-yielding one. In a scare those trades are closed, which means buying the yen back.
The Swiss franc's reputation rests on political stability, a large current account surplus and a long record of low inflation.
The US dollar is the main currency for world trade, debt and central bank reserves. In a crisis, borrowers around the world who owe dollars need to buy them.
That demand can lift the dollar even when the trouble began in the United States.
Which currencies gain when appetite for risk returns?
The Australian, New Zealand and Canadian dollars are often called commodity currencies. Their economies export a lot of raw materials, so they tend to do well when traders expect strong global growth. The commodity currencies lesson explains the link.
These currencies have often paid higher interest rates than the yen or the franc, which made them common targets in carry trades. That gap changes whenever central banks move rates, so check it rather than assume it.
Emerging market currencies, such as the Mexican peso and the South African rand, usually react the most. They offer higher yields but carry more country risk, so money tends to leave them quickly in a scare.
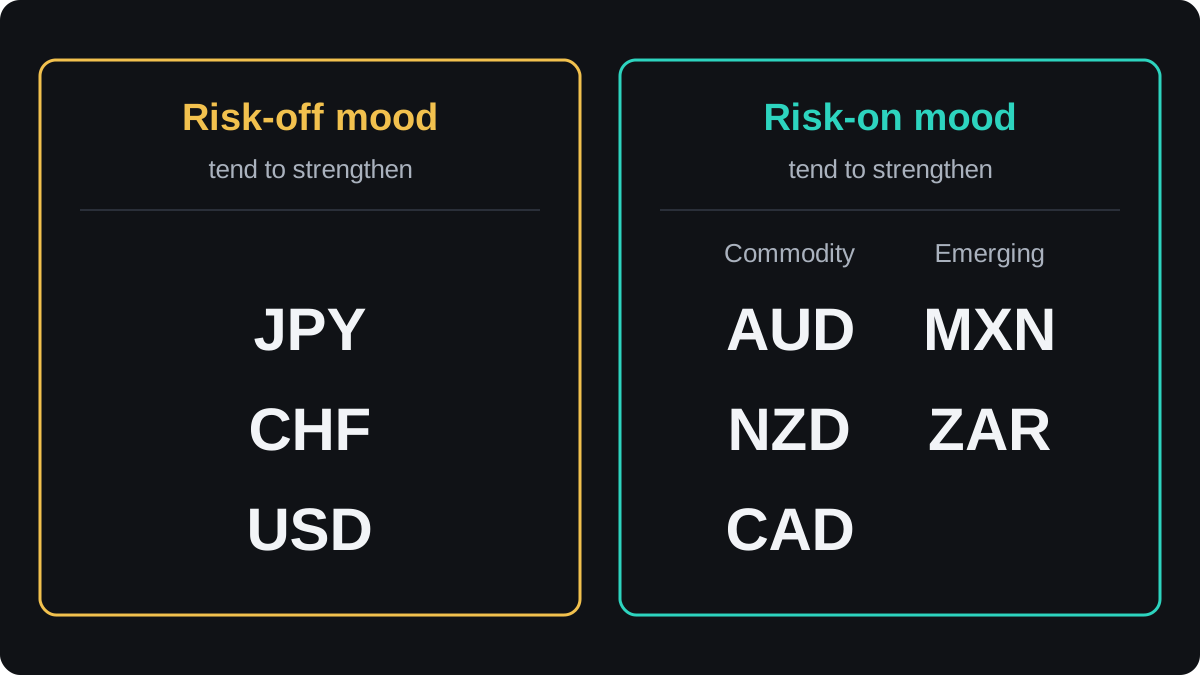
These groups are tendencies. A currency can switch sides for a while when its own domestic news is strong enough.
How a risk-off day moves AUD/JPY
A pair that sets a risk-on currency against a safe haven feels both forces at once. AUD/JPY is a common example, because it pairs a commodity currency with the yen.
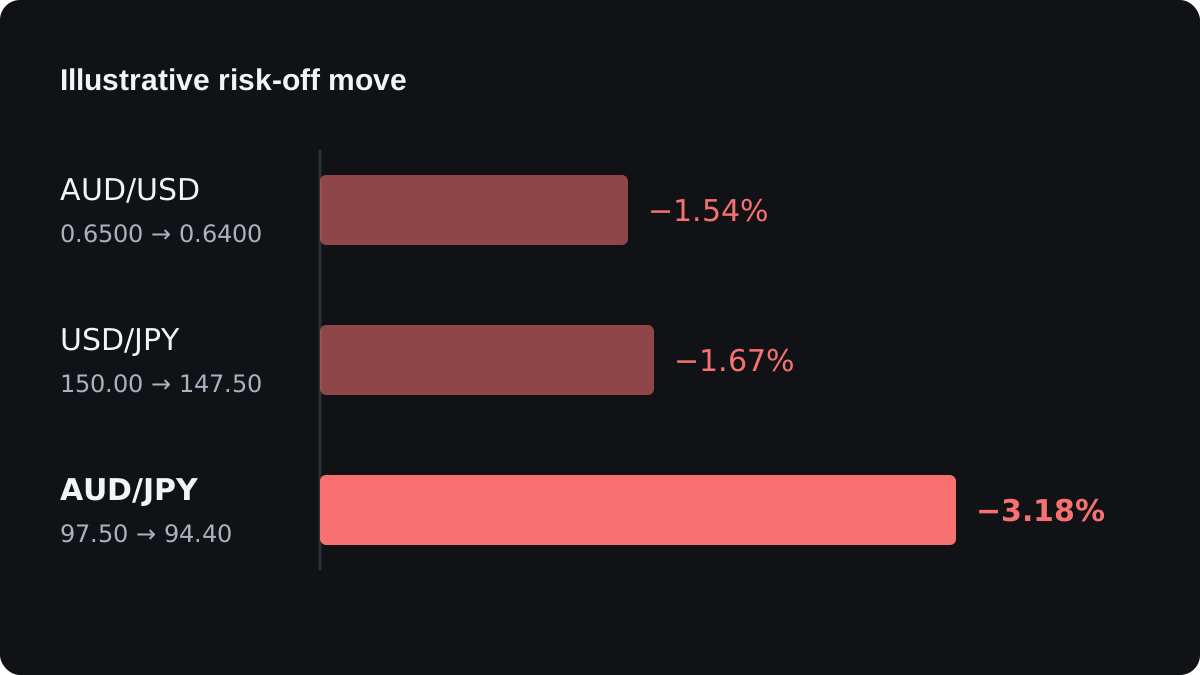
Take round illustrative prices. AUD/USD is 0.6500 and USD/JPY is 150.00, so AUD/JPY is 0.6500 × 150.00 = 97.50.
A shock hits. The Australian dollar weakens and AUD/USD falls to 0.6400. The yen strengthens, so USD/JPY falls to 147.50. AUD/JPY is now 0.6400 × 147.50 = 94.40.
| Pair | Before | After | Change |
|---|---|---|---|
| AUD/USD | 0.6500 | 0.6400 | −1.54% |
| USD/JPY | 150.00 | 147.50 | −1.67% |
| AUD/JPY | 97.50 | 94.40 | −3.18% |
The two falls stack up. The cross moves about as much as both dollar pairs together, because each side of it is pushed the same way.
Now suppose you were long 0.10 lot of AUD/JPY at 97.50 and closed at 94.40. The spread is left out to keep the sum clear.
- A standard lot is 100,000 units of the base currency, so 0.10 lot is 10,000 Australian dollars.
- A pip on a JPY pair is 0.01, so one pip is worth 10,000 × 0.01 = ¥100.
- The move is 94.40 − 97.50 = −3.10, which is −310 pips.
- The loss is 310 × ¥100 = ¥31,000.
- In a US dollar account at USD/JPY 147.50, that is 31,000 ÷ 147.50 = $210.17.
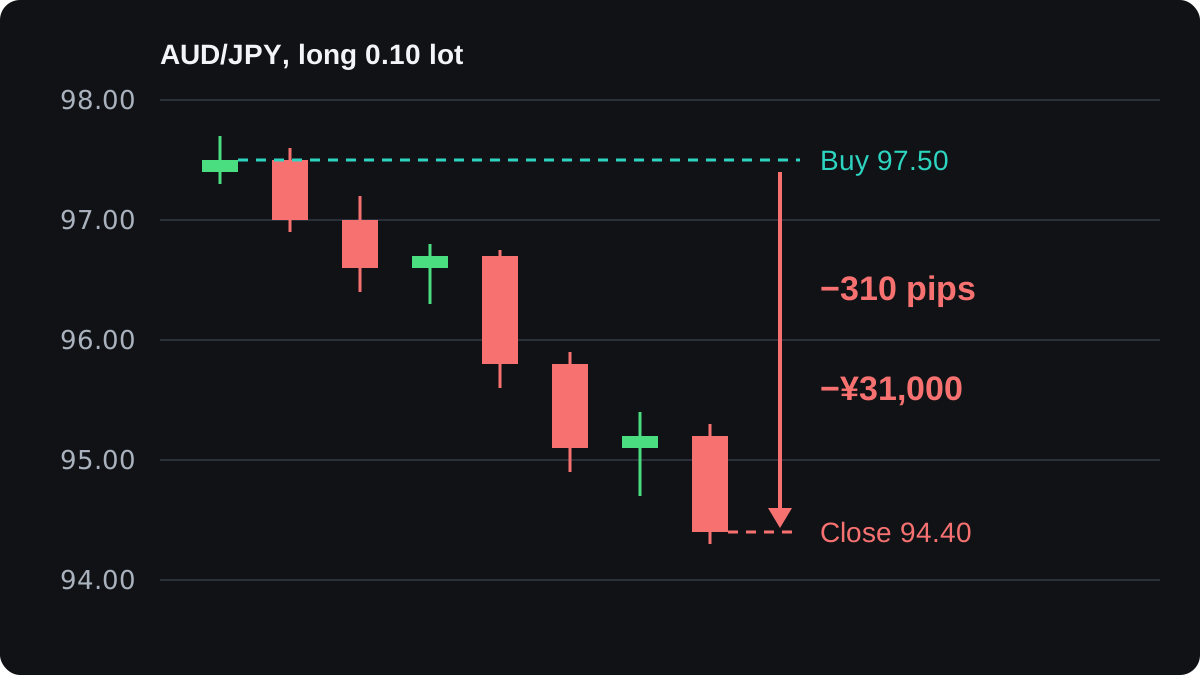
A short of the same size over the same prices would have gained ¥31,000 before costs. The dollar figure depends on the rate at which your broker converts the yen.
How can you read the market's mood?
No single number tells you the mood. Traders usually look at several markets and check whether they agree.
- Stock indices such as the S&P 500 or the Nikkei 225. Broad rises point to risk-on and sharp falls to risk-off, as the lesson on stocks and risk appetite shows.
- The VIX, a Cboe index that uses option prices to estimate how volatile the S&P 500 is expected to be over the next 30 days. A jump usually comes with risk-off.
- Yields on major government bonds. In a scare, buying of bonds such as US Treasuries often pushes their yields down.
- Gold, which often gains in fear, though it also reacts to the dollar and to interest rates after inflation.
- Crosses between a risk currency and a safe haven, such as AUD/JPY or NZD/JPY.
When these signals point the same way, the label is fairly clear. When they disagree, the market is usually reacting to one specific story, and the simple two-mood picture fits less well.
The correlation matrix lets you check how closely pairs have moved together, which is one way to see whether the usual pattern still holds.
Where the risk-on, risk-off idea breaks down
The pattern describes many past stress episodes well, and it has clear exceptions. Treat it as a background tendency with no fixed strength.
Interest rates can override it. In 2022, US rates rose quickly while Japanese rates stayed near zero, and the yen fell sharply against the dollar in a year when global shares also fell.
The source of the shock matters. If the trouble starts inside Japan or Switzerland, the safe-haven role of that currency can weaken or reverse.
Central banks can step in. Japan's authorities have at times bought yen to slow a fall, and the Swiss National Bank has sold francs to slow a rise. See currency intervention for how these moves work.
The dollar's role is the least stable. In some sell-offs it rises with the yen, and in others it has weakened, especially when the worry centres on the United States itself.
The label also comes after the move. By the time a day is widely called risk-off, much of the price change may already be done, so the idea explains moves better than it times them.
Sentiment can be read from positioning as well as prices. The next lesson covers the Commitments of Traders report, which shows how large speculators in futures are positioned.
Pertanyaan
What does risk-off mean in forex?
Risk-off is a market mood in which investors sell riskier assets and buy safer ones. In forex it usually means the yen and the Swiss franc gain, while the Australian dollar and emerging market currencies fall.
Why does the yen often rise when stocks fall?
Two common explanations are that Japanese investors bring money home in a panic and that yen-funded carry trades are closed, which means buying yen back. Neither is guaranteed: in 2022 the yen fell while shares also fell.
Is the US dollar a safe haven?
Often, because companies and banks worldwide need dollars in a crisis. It is less reliable than the yen or the franc, and it can weaken when the problem is in the United States.
Is AUD/JPY a good measure of risk appetite?
It is a rough one, because it combines a risk-sensitive currency with a safe haven. Australian or Japanese news can move it on its own, so compare it with stocks and bond yields.
Can you trade risk-on and risk-off moves?
You can take positions that would gain if the mood shifts, such as a short on AUD/JPY ahead of a feared shock. The pattern breaks often enough that any such trade still needs its own stop loss and position size.
Lanjut belajar
 Bab 8The Commitments of Traders report.The Commitments of Traders (COT) report is a weekly breakdown, published by the US Commodity Futures Trading Commission, of who holds long and short positions in US futures markets, including currency futures. It shows positions as of Tuesday and usually comes out on Friday, so it is three days old on arrival and leaves out over-the-counter forex.
 Bab 8Retail positioning as a contrarian signal.Retail positioning data shows what share of one broker's clients are long or short a pair. Contrarian traders read it in reverse: a crowd heavily long hints the price may fall, since retail traders tend to buy into declines. It is a weak, one-broker signal that can stay extreme for weeks, so it needs a chart and testing.

