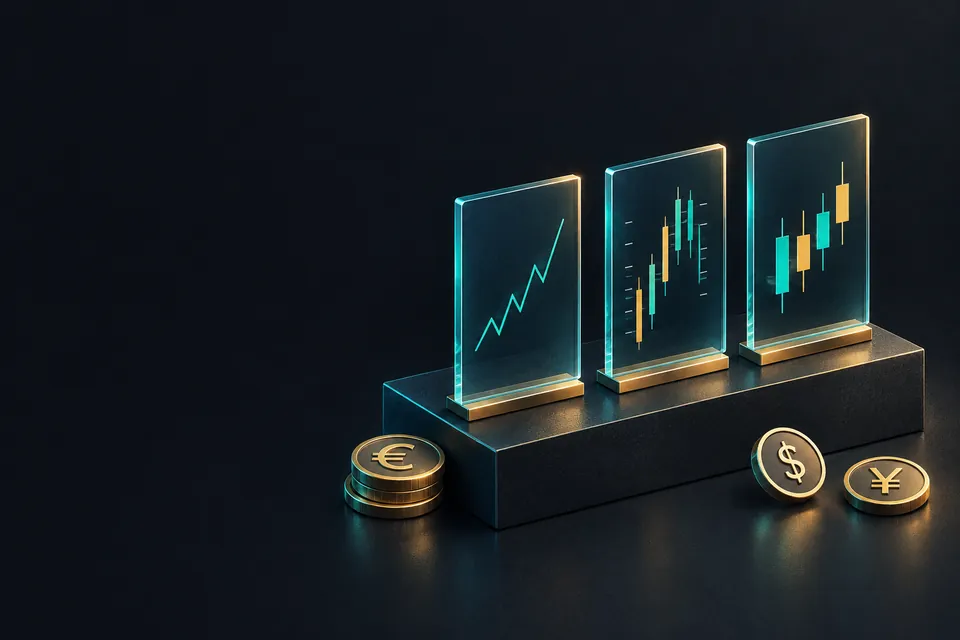
Which chart type should you use?
Use candlestick or bar charts when you need the full picture of each period: open, high, low and close. They show where a stop could have been hit. Use a line chart of closing prices to see the broad direction or compare markets. Bars and candles hold the same data, and candles make each period's direction easier to spot.
이 내용은 현재 영어로만 제공됩니다.
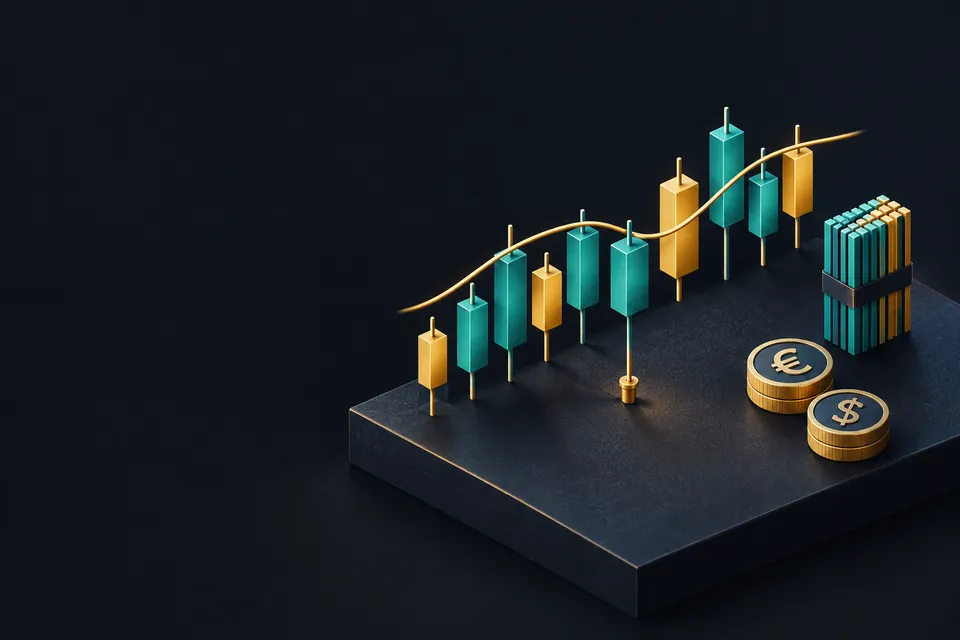
Most trading platforms let you switch the same price history between a line, bars and candlesticks with one click. The prices underneath stay the same. What changes is how much of each period you can see, and what is left out.
What does each chart type actually draw?
Every period on a chart, whether one minute or one day, has four prices: the open, the high, the low and the close. The chart types lesson showed how each chart is built from them.
A line chart joins the closing prices and drops the other three. A bar chart draws all four, with a vertical line from low to high, a small tick on the left for the open and one on the right for the close.
A candlestick chart draws the same four prices. The body is the box between the open and the close, and the thin lines above and below it, called wicks, reach the high and the low.
Bars and candlesticks therefore carry identical information. A line chart carries one price out of four for each period.
What can a line chart hide?
Here are four hours of EUR/USD with round illustrative prices. A pip on this pair is 0.0001.
| Hour | Open | High | Low | Close |
|---|---|---|---|---|
| 1 | 1.08500 | 1.08560 | 1.08480 | 1.08540 |
| 2 | 1.08540 | 1.08580 | 1.08320 | 1.08550 |
| 3 | 1.08550 | 1.08600 | 1.08510 | 1.08520 |
| 4 | 1.08520 | 1.08620 | 1.08500 | 1.08600 |
Work through what each chart shows:
- A line chart plots only the closes: 1.08540, 1.08550, 1.08520 and 1.08600. The lowest is 1.08520 and the highest is 1.08600, a band of 0.00080, or 8 pips.
- Bars or candles use the highs and lows too. The lowest low is 1.08320 in hour 2, and the highest high is 1.08620 in hour 4.
- 1.08620 minus 1.08320 is 0.00300, so price really travelled across 30 pips.
- Inside hour 2, price fell from its open at 1.08540 to 1.08320, a drop of 22 pips, then climbed back to close at 1.08550.
Now suppose you bought EUR/USD earlier with a stop loss at 1.08350. The line never dips below 1.08520, so your trade looks safe by 17 pips.
The candles tell a different story. Price traded down to 1.08320, 3 pips beyond your stop, so the trade was closed during hour 2.

A line chart is drawn only from closes, so it cannot show you where a stop or a pending order was triggered between them.
Bars or candlesticks: which is easier to read?
Take hour 4 from the table: open 1.08520, high 1.08620, low 1.08500, close 1.08600. On a bar chart, the left tick sits at 1.08520 and the right tick at 1.08600.
On a candlestick chart, a body fills the space between those two prices. Both drawings show a body of 8 pips (1.08520 to 1.08600) and a range of 12 pips (1.08500 to 1.08620).

The filled, coloured body makes candles quick to scan. Up and down periods, and large and small moves, stand out without reading any ticks.
Bars use less ink. When you want to compare the highs and lows of hundreds of periods on one screen, a bar chart can look less crowded.
Neither one is more accurate, because the data is the same. Candlestick pattern names, such as the hammer, describe the shape of candles, and their record as signals is mixed, so treat any pattern as one clue among several.
Colours are a platform setting. Green and red are common, but some platforms use white and black, or hollow and filled bodies, so check which colour means up on yours.
When does each chart type fit?
Choose the chart by the question you are asking. This table matches common tasks to the chart that answers them.
| Task | Chart that fits | Why |
|---|---|---|
| See the broad direction over months or years | Line | Closes only, so less clutter |
| Compare two markets on one screen | Line | Two lines overlay cleanly |
| Place or check a stop loss | Bar or candlestick | Shows the highs and lows a stop can be hit at |
| Measure how far price swings in a period | Bar or candlestick | High minus low is visible |
| Read candle patterns | Candlestick | Patterns are defined by bodies and wicks |
| Mark support and resistance | Either | Each gives a slightly different level |
Support and resistance sit in the middle. Levels drawn on a line chart come from closes, while levels on candles can use the wicks or the bodies, and the two often land a few pips apart.
That gap is one reason to treat a price level as a zone of a few pips. The support and resistance lesson, next in the course, starts from there.
How does the timeframe change what you see?
Switching from a line to candles changes how you see the same periods. Switching the timeframe changes the periods themselves.
On a 4-hour chart, the four hours in the table become one candle, built like this:
- Open: the first open, 1.08500.
- High: the highest high, 1.08620.
- Low: the lowest low, 1.08320.
- Close: the last close, 1.08600.
That candle is up 1.08600 minus 1.08500 = 0.00100, or 10 pips, inside a 30-pip range. The drop that hit the stop is still visible, now as a lower wick of 18 pips, from 1.08500 down to 1.08320.

On a daily chart these hours are only part of one candle. The choosing timeframes lesson covers how to pick the periods you watch.
Forex trades around the clock on weekdays, so the moment a day ends depends on the broker's server time. Two platforms with different server times can draw different daily candles from the same market.
Which chart should a new trader start with?
Candlesticks are widely used, and the rest of this course draws charts with them. Once you can read a candlestick, a bar chart holds no surprises.
Keep a line chart for zooming out. A line of weekly closes over a few years shows the broad direction with less clutter than hundreds of candles.
Treat smoothed charts with care. Heikin Ashi candles are built from averages, so their open and close are usually not the real open and close of the period.
자주 묻는 질문
Is a candlestick chart better than a line chart?
A candlestick chart shows more: the open, high, low and close of each period. A line chart has only the close, which is useful for direction but hides the swings in between.
Do bar charts and candlestick charts show the same data?
Yes. Both draw the open, high, low and close of every period. A bar uses two small ticks, and a candle uses a filled body.
Why was my stop loss hit when the line chart never reached it?
Can I change the chart type without affecting my trades?
Yes. The chart type only changes how prices are drawn on your screen. Your orders, stops and open positions stay exactly as they were.
Which chart type should a beginner start with?
Candlesticks are a practical start because most lessons and many platforms use them. Add a line chart when you want a quick view of the long-term direction.