Moving averages as dynamic support and resistance.
Dynamic support is a moving average that sits below price in an uptrend and keeps rising with it, so pullbacks sometimes pause near the line. Dynamic resistance is the same idea above price in a downtrend. Treat the line as a rough zone. It is most useful in clear trends and often fails in ranges.
이 내용은 현재 영어로만 제공됩니다.

Picture a chart in a steady uptrend with a moving average drawn under the candles. Price climbs, dips back to the line, then climbs again. After a few of those dips, the line starts to look like a floor.
That floor is called dynamic support: a support level that moves with price. In a downtrend the same kind of line sits above price, and rallies keep fading near it. That is dynamic resistance.
How is a moving level different from a fixed one?
A horizontal support level is one price, such as 1.08000, where buyers stepped in before. It stays at that price until you redraw it.
A moving average is recalculated each time a candle closes. In an uptrend, each new close tends to be higher than the old close that drops out of a simple average, so the line rises.
So a pullback that meets the line on Monday meets it at a higher price on Friday. The level climbs with the trend, while a horizontal level stays at its old number.
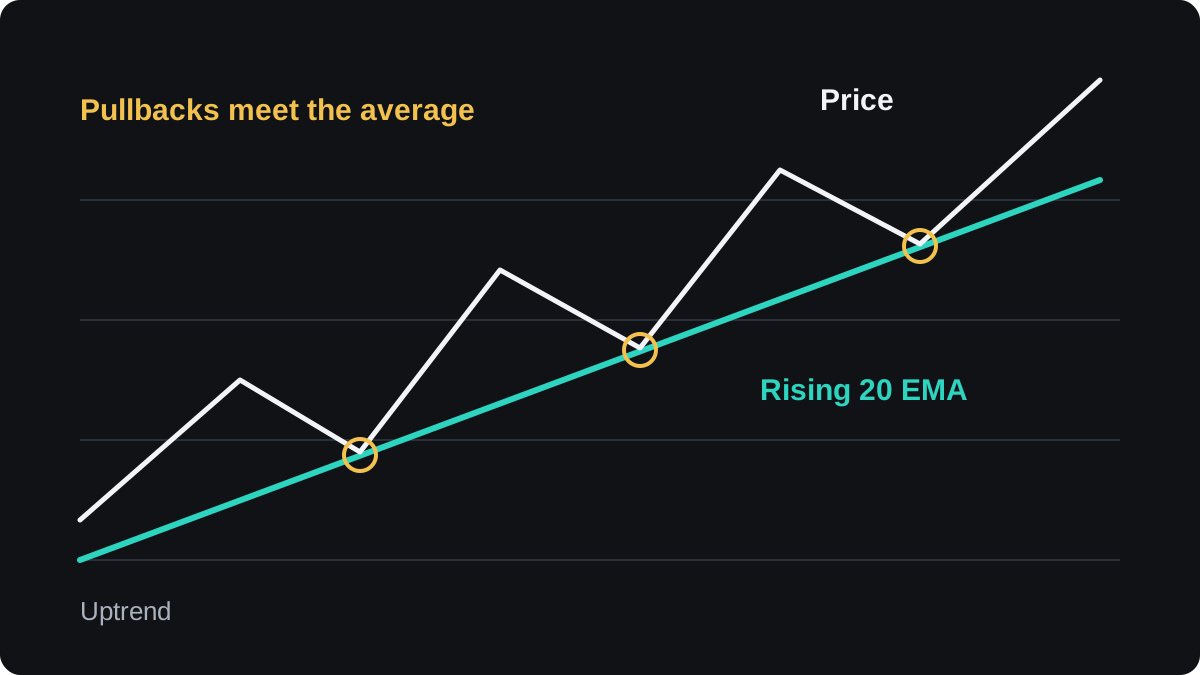
In a clean uptrend, price can dip toward the rising average and then turn up to a new high. The figure shows three pullbacks to a 20 period EMA, each meeting the line higher than the one before.
A downtrend is the mirror image, with the average sloping down above price. The trend direction lesson covers how to read the slope itself.
Why would price react at an average at all?
No rule of the market makes price respect a line on a chart. The reactions you see have plainer causes, and knowing them stops you giving the line more weight than it deserves.
One cause is that the average marks the typical price of the recent past. A pullback to it in a trend gives back the latest gains, and buyers who missed the move may see a fair place to join.
Another cause is habit: the 20, 50 and 200 period averages are common settings, so many chart users watch the same lines. Orders placed near them can produce part of the reaction everyone expects.
The evidence that averages hold better than chance is thin. Example charts are usually picked after the fact, so the clean touches stand out and the failed ones are forgotten.
Which average makes the better level?
No single setting is correct. The choice mainly changes how often price reaches the line and how deep a pullback must be to get there.
A fast average, such as a 20 period EMA, hugs price. In a strong trend it gets touched often, and when the trend tires it also gets broken often. The SMA or EMA lesson explains why an EMA reacts faster.
A slow average, such as the 200 period SMA, sits far from price. Touches are rare, and reaching it takes a deep pullback that may already be a change of trend.
| Average | Distance from price | Touches | Common use |
|---|---|---|---|
| 20 EMA | Close | Frequent | Shallow pullbacks in strong trends |
| 50 SMA | Medium | Occasional | Deeper swing pullbacks |
| 200 SMA | Far | Rare | Long-term trend filter |
Timeframe matters as much as the period. A 50 period average on a 4-hour chart covers 200 hours, a little over eight 24-hour trading days. On a daily chart the same setting covers about ten weeks.
Pick one average for this job and keep it. Switching settings until one fits the last bounce is curve fitting: it describes the past chart and says little about the next pullback.
How close is close enough?
Price rarely stops exactly on an average. It turns a few pips short, or a wick pokes through and the candle closes back on the other side. If you demand a perfect touch, you will miss most reactions.
Treat the area around the line as a zone, as the support and resistance zones lesson does for horizontal levels. Choose a fixed buffer in pips for your pair and timeframe, and use the same one every time.
Closes tell you more than wicks. A wick below a rising average that closes back above it suggests sellers pushed through and could not stay there. Two closes below the line suggest the level may have given way.
A worked pullback trade on EUR/USD
The prices below are round and illustrative. The example shows the mechanics of one rule and is not a recommendation to trade it.
You are watching a 4-hour EUR/USD chart with a rising 50 period SMA, in a US dollar account. The pair made a high at 1.08900 and is now pulling back.
- A candle dips to 1.08380, two pips below the SMA at 1.08400, then closes at 1.08460, back above the line.
- Your rule is to buy only if price trades above that candle's high of 1.08480, so you set the entry at 1.08500.
- The stop goes at 1.08200, 18 pips under the candle's low, to leave room for a deeper wick. The distance is 1.08500 minus 1.08200 = 0.00300, or 30 pips.
- Your account is $5,000 and you risk 1%, so the most you plan to lose is $50. That allows $50 ÷ 30 = about $1.67 per pip.
- On EUR/USD in a USD account, 0.01 lot is worth $0.10 per pip. Rounding down gives 0.16 lot at $1.60 per pip, so the planned risk is 30 × $1.60 = $48.
- The target is twice the stop distance: 60 pips above entry, at 1.09100. If price gets there, the gain is 60 × $1.60 = $96.
The chart shows the plan at the moment of entry. The SMA will keep rising after the touch, but your stop stays where you placed it unless you decide to move it.
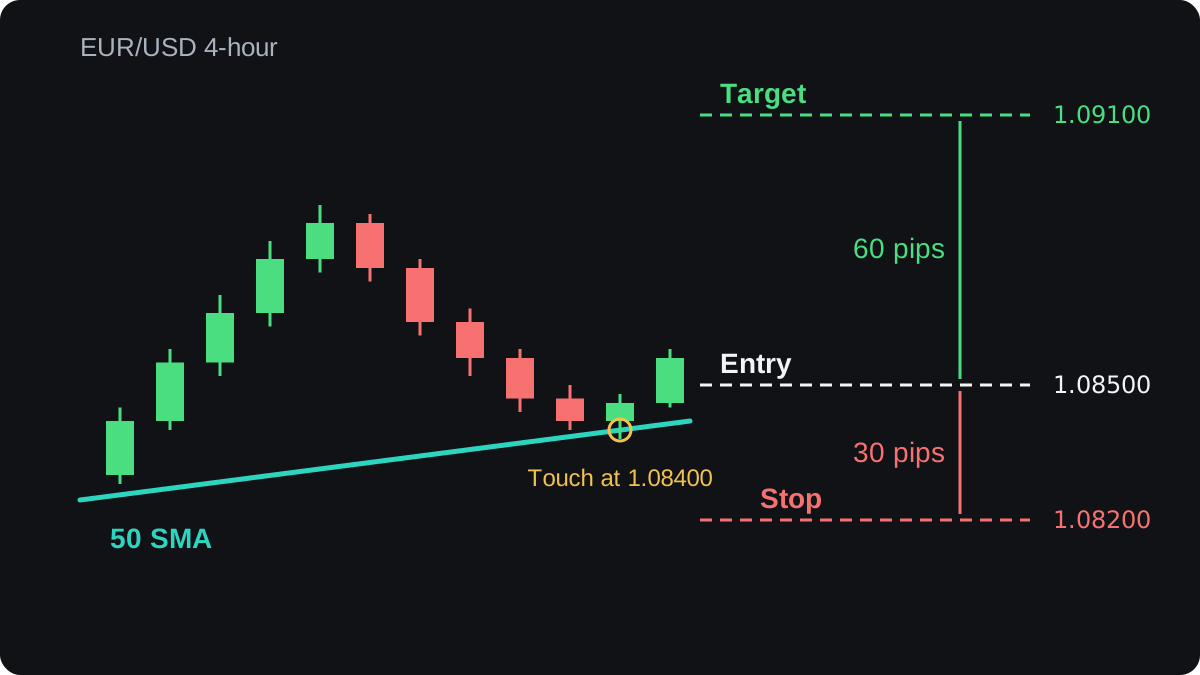
Nothing in the setup tells you the outcome. The pullback can carry on through the line and hit the stop for a loss of about $48, or more if price jumps past it, which is why the stop and the size were fixed before entry.
The position sizing lesson repeats this calculation for other pairs. If you want the stop to follow the average as the trade moves, the trailing stops lesson covers that method and its trade-offs.
When does dynamic support fail?
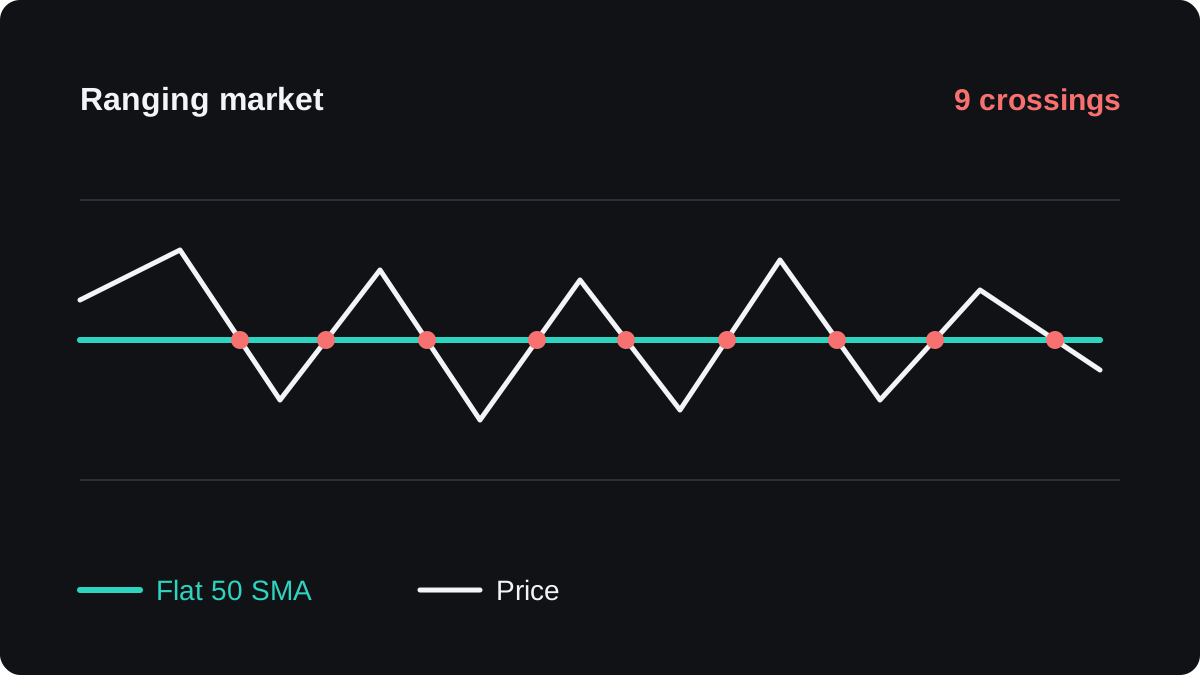
The idea needs a trend. When the market moves sideways, the average flattens and price crosses it in both directions, so the line stops marking anything useful.
In the range shown next, price crosses a flat 50 SMA nine times. Each cross could be read as a bounce or a break, and none of them leads to a lasting move.
The trending versus ranging lesson shows ways to tell the two conditions apart before you rely on the line. Other failures are worth knowing too:
- A major news release can push price straight through an average, and a fast move can fill your stop at a worse price than you set.
- A trend cannot turn without price crossing its average, so a break can be an early warning, though many breaks come to nothing. After a real reversal, the old dynamic support can start to cap rallies, the same role reversal seen at horizontal levels.
- A pullback that runs well past a fast average may be a dip or the start of a reversal, and the line alone cannot tell you which.
The moving averages cheat sheet puts these rules on one page.
자주 묻는 질문
Which moving average is best as dynamic support?
No single average is best for every pair and timeframe. The 20 EMA, 50 SMA and 200 SMA are common choices, so pick one, test it on your own charts and keep it.
Is a moving average stronger than a horizontal support level?
There is no solid evidence that it is. A spot where the average and a horizontal level meet draws more attention, but even that can fail, so it still needs a stop.
Should you buy every time price touches the moving average?
No. A touch in a range means little, and touches in a trend fail too. Wait for the rule you wrote in advance, such as a close back above the line, and always set a stop.
Can a moving average be resistance in a downtrend?
Yes. A falling average above price can mark where rallies fade, and the same limits apply, including false breaks and repeated crossings in a range.
이어서 배우기
 챕터 4What is a moving average?A moving average is the average closing price over a set number of recent candles, recalculated every time a new candle closes. Plotted as a line, it smooths out small price swings so the direction of the trend is easier to see. Because it is built from past prices, it always lags behind the market.
 챕터 4Simple moving average (SMA).A simple moving average (SMA) adds the closing prices of the last N candles and divides by N. Each new candle adds one price and drops the oldest, so the line rolls forward. Every price carries equal weight, so one unusually large close lifts the average and moves it again when it drops out.
 챕터 4Exponential moving average (EMA).An exponential moving average (EMA) is an average of past prices that gives the latest close the most weight. Each period it moves part of the way toward the new price, by a share set by k = 2 ÷ (N + 1). It turns sooner than a simple moving average, but it still lags and gives false signals in sideways markets.
 챕터 4SMA or EMA: which should you use?An SMA gives every price in its window the same weight, so it is smooth but slow to turn. An EMA gives the newest prices more weight, so it turns sooner but reacts more to noise. Neither is better in general: choose by the job and test it on your own charts.
 챕터 4Using moving averages to read the trend.A moving average gives two trend readings. Price above the line means the latest close is higher than the average, and price below means lower. The line's slope shows whether the average itself is rising or falling. When both point the same way, the trend reading is clear; when they disagree, it is mixed.
 챕터 4Moving average crossovers.A moving average crossover is the moment a fast moving average crosses a slow one. A cross above is read as a buy signal and a cross below as a sell signal. Because both lines are built from past prices, the signal always comes after the turn, and sideways markets produce repeated false crosses.
 챕터 4Moving averages cheat sheet.A moving average is the average of recent closing prices, recalculated on every new bar. The SMA weights the last N closes equally, and the EMA weights recent closes more, so it reacts faster. Traders use the slope for trend, fast and slow crossovers as signals and the line as moving support or resistance, and every version lags price.

