How to trade with pivot points.
Pivot points give two common trade setups. In a range, traders buy near S1 or sell near R1 and target the central pivot. On a breakout, they trade a candle close through R1 or S1 toward R2 or S2. In both, the stop sits just beyond the level, so a failed level costs a small, planned loss.
이 내용은 현재 영어로만 제공됩니다.

A pivot calculation gives you seven price levels before the trading day starts. Traders use them in two opposite ways: trading against moves at the inner levels when the market ranges, and following moves that break through them when it trends.
The levels come from the previous day's high, low and close. If you are new to them, start with what pivot points are. Every example here uses the standard formula and round illustrative prices.
How do you work out today's levels?
Take a made-up day on EUR/USD. Yesterday's high was 1.10600, the low was 1.09800 and the close was 1.10500.
- Pivot (P) = (high + low + close) ÷ 3 = (1.10600 + 1.09800 + 1.10500) ÷ 3 = 3.30900 ÷ 3 = 1.10300.
- R1 = 2 × P − low = 2.20600 − 1.09800 = 1.10800.
- S1 = 2 × P − high = 2.20600 − 1.10600 = 1.10000.
- The range is high − low = 1.10600 − 1.09800 = 0.00800, which is 80 pips.
- R2 = P + range = 1.10300 + 0.00800 = 1.11100.
- S2 = P − range = 1.10300 − 0.00800 = 1.09500.
- R3 = high + 2 × (P − low) = 1.10600 + 2 × 0.00500 = 1.11600.
- S3 = low − 2 × (high − P) = 1.09800 − 2 × 0.00300 = 1.09200.
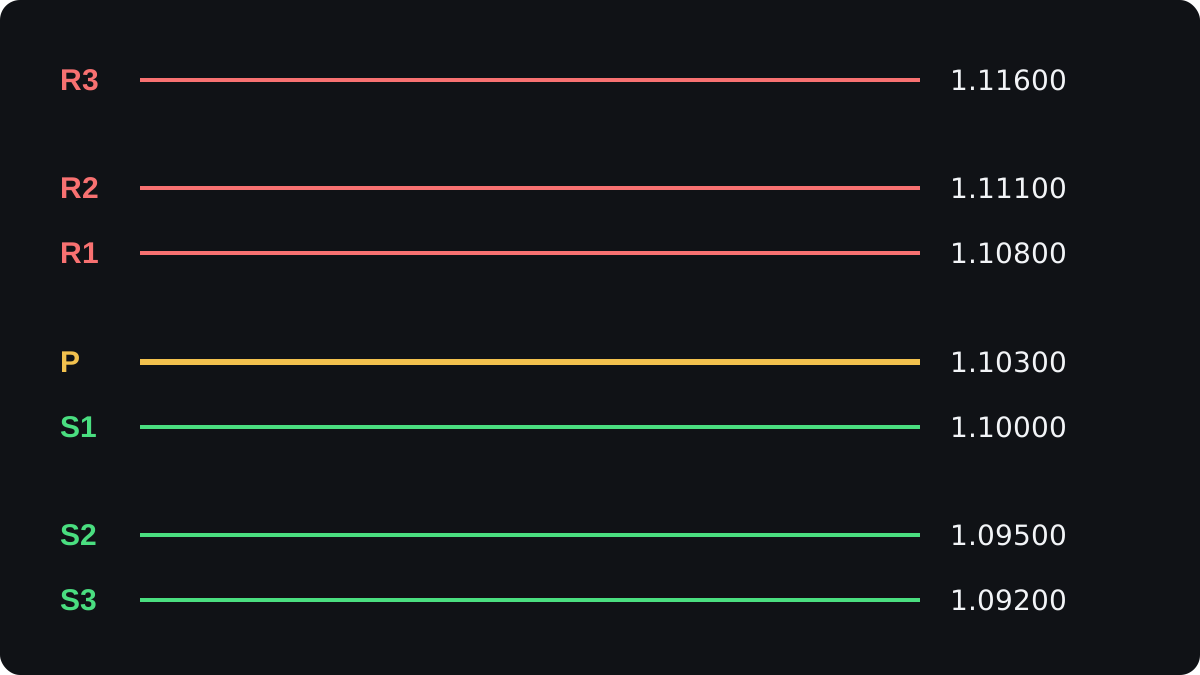
The gaps are uneven. R1 is 50 pips above the pivot and S1 only 30 pips below it, because yesterday closed near its high.
R3 sits 130 pips above the pivot here, which is 100 pips above yesterday's high. Price only gets there on a day that pushes far beyond the previous day's range.
The pivot point calculator repeats this arithmetic for any pair. It also gives the Fibonacci and Camarilla sets from the previous lesson.
What does the central pivot tell you?
Where price trades relative to P is a rough guide to the session's lean. Pivot traders treat price above P as a buying lean and price below it as a selling lean.
One simple filter is to take only buys above P and only sells below it.
Treat that as context, never as a signal on its own. On a quiet day price can cross the pivot several times, and a single cross tells you little.
The open gives a second clue. If price starts near P and stays between S1 and R1 for the first hours, the day may be ranging.
An open far beyond R1 or S1, often after overnight news, points more toward a trending day. Neither outcome is certain.
How does a range trade from S1 or R1 work?
On a ranging day price swings between the inner levels. The range trader buys near S1 or sells near R1 and uses the pivot as the target.
The level alone is no reason to trade. Wait for some sign that it is holding, such as a candle that dips through S1 and closes back above it.
A buy at S1, using the levels above:
- EUR/USD drifts down from the pivot and touches S1 at 1.10000.
- A candle dips to 1.09960, then closes at 1.10050. You buy at 1.10050.
- The stop goes below the wick and the level, at 1.09900. The risk is 1.10050 − 1.09900 = 0.00150, or 15 pips.
- The target is the pivot at 1.10300. The reward is 1.10300 − 1.10050 = 0.00250, or 25 pips.
- On 0.30 lot a pip is worth $3, so the stop loses 15 × $3 = $45 and the target gains 25 × $3 = $75.
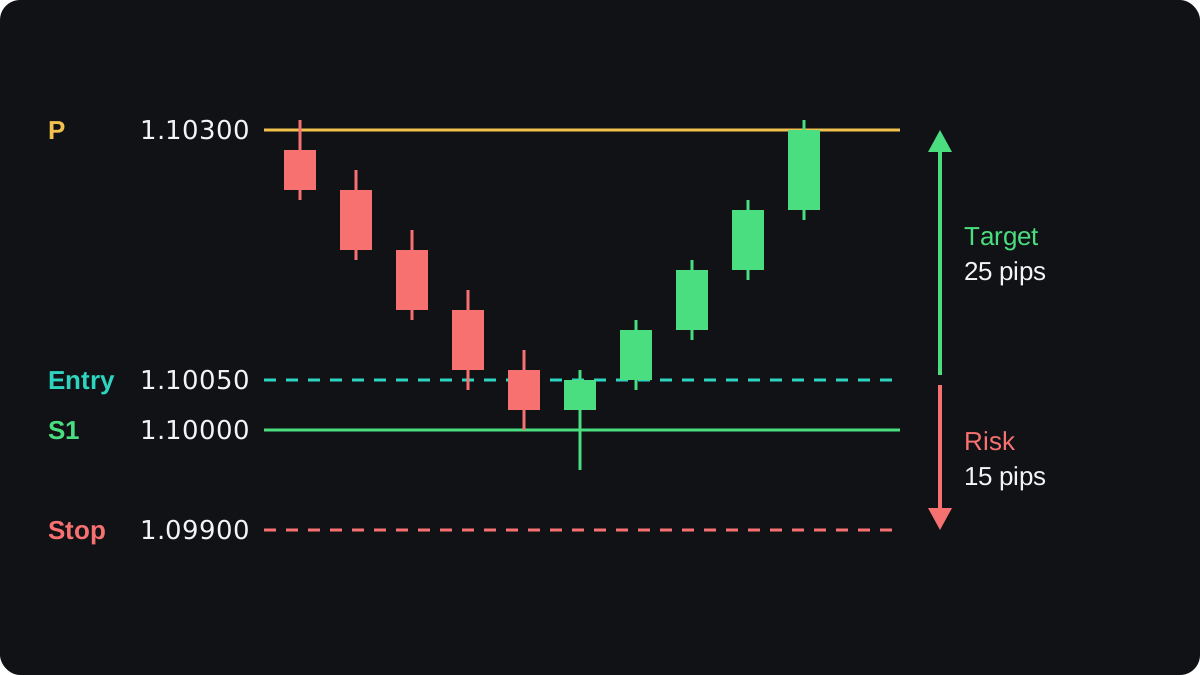
The reward is 25 ÷ 15, about 1.67 times the risk. Choose the lot size from the 15 pip stop and the money you are willing to lose, as shown in how to calculate position size.
Small targets feel the spread. If your chart plots bid prices, as MetaTrader does by default, a 1 pip spread fills your buy at 1.10060. The trade then risks 16 pips to make 24, or $48 to make $72.
The stop sits just beyond S1 because a break there would undo the idea. The day may be turning into a trend, and the next standard level below is S2 at 1.09500, 50 pips lower.
How does a breakout trade through R1 or S1 work?
The breakout trader takes the other side of the same idea. When price pushes through R1 or S1 and holds, they trade in the direction of the break and aim for the next level out.
One filter is a candle close beyond the level on the timeframe you trade. A wick that pokes through and falls back is weaker evidence.
A buy through R1, with the same levels:
- EUR/USD spends the morning below R1 at 1.10800, with highs near 1.10790.
- An hourly candle closes at 1.10850, 5 pips above R1. You buy at 1.10850.
- The stop goes back below R1, at 1.10750. The risk is 1.10850 − 1.10750 = 0.00100, or 10 pips.
- The target is R2 at 1.11100. The reward is 1.11100 − 1.10850 = 0.00250, or 25 pips.
- On 0.20 lot a pip is worth $2, so the stop loses 10 × $2 = $20 and the target gains 25 × $2 = $50.
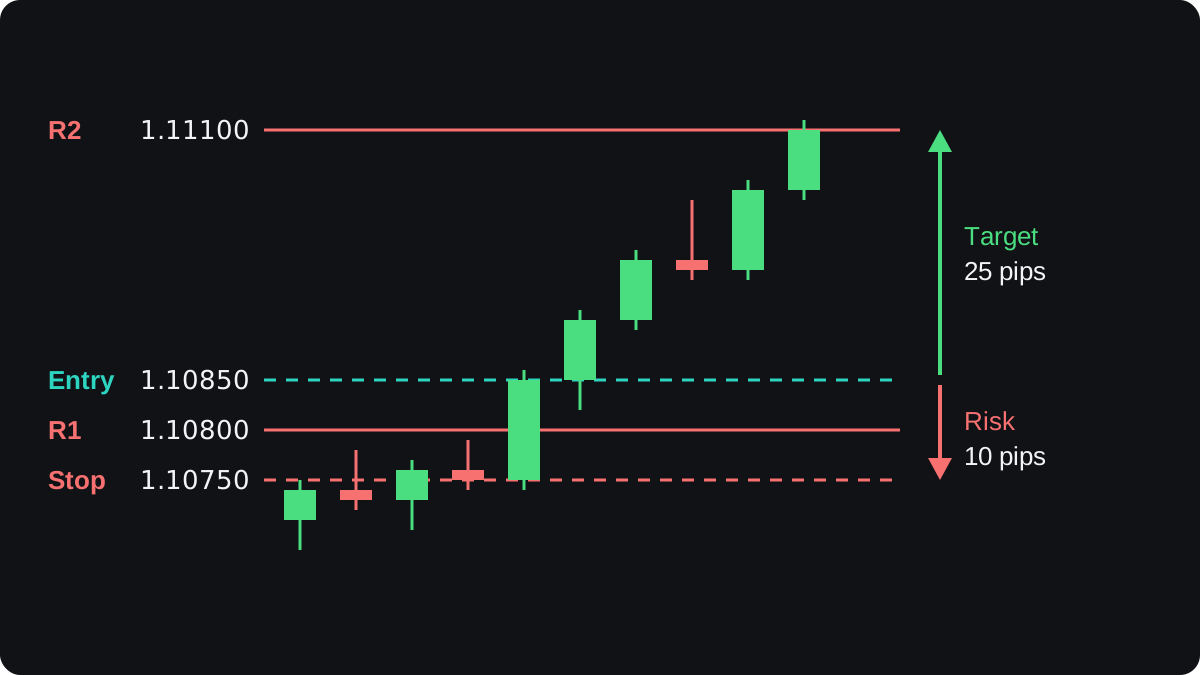
Some traders wait for price to return and test R1 from above before buying. That gives a better entry price when it happens, though on a strong day price may never come back.
A move through R1 that closes back below it is a false breakout. The tight stop below R1 is there to take you out of it for a small loss.
Why do pivot trades fail?
Pivots are arithmetic on yesterday's prices and know nothing about today. A central bank decision or a surprise jobs report can push price through every level in minutes, so check the economic calendar before the session.
The two methods also contradict each other. At the same R1, the range trader sells and the breakout trader buys. Decide in advance which rule applies, or the levels will give you a reason to trade every move.
Picking the right method depends on telling trending and ranging markets apart. That is hardest in real time, and often clear only once the day is over.
The evidence for pivots is thin. Many charting tools show them, so orders may gather near the levels, which could explain some reactions at them.
There is no strong, widely accepted evidence that pivot levels predict turning points on their own. Test any pivot rule on past data and a demo account before using real money.
Which pivots, and which day's data?
Your levels depend on which daily candle your platform uses. Forex trades around the clock on weekdays, so each broker picks a closing time, and two platforms can show different pivots for the same pair.
A common choice is 17:00 New York time, but check your own broker's server time.
If your charts show a short Sunday candle, check whether Monday's levels were built from it. A few hours of thin trading make a poor base.
The same formulas work on longer periods. Match the set to how long you hold trades:
| Pivot set | Built from | Usually read on |
|---|---|---|
| Daily | Previous day's high, low and close | 5-minute to 1-hour charts |
| Weekly | Previous week's high, low and close | 4-hour and daily charts |
| Monthly | Previous month's high, low and close | Daily and weekly charts |
The pivot points cheat sheet puts the formulas and both setups on one page.
자주 묻는 질문
Do pivot points work in forex?
They mark levels that many charts display, and price sometimes reacts there. They do not predict direction on their own, and on news days price can run through all of them, so test any rule before using real money.
Is range trading or breakout trading better with pivots?
Neither is better in general. Range trades suit quiet days between S1 and R1, breakout trades suit days with strong moves, and you need a rule for telling them apart.
What timeframe should I use with daily pivots?
Daily pivots are usually traded on intraday charts, from about 5 minutes to 1 hour. For 4-hour or daily charts, weekly pivots fit better.
Why are my pivot levels different from another website's?
The two sources are probably using different daily closing times, so their high, low and close differ. One of them may also use another formula, such as Fibonacci or Camarilla.
Where should the stop go on a pivot trade?
Just beyond the level you are trading, past any wick that touched it. If that level fails, the idea behind the trade has failed too.
이어서 배우기
 챕터 3What are pivot points?Pivot points are support and resistance levels calculated from the previous period's high, low and close. The main pivot, P, is the average of those three prices. Formulas built from P and the previous high and low then give resistance levels R1 to R3 above it and support levels S1 to S3 below it, fixed for the whole period.
 챕터 3Standard, Fibonacci and Camarilla pivots.All three methods use the previous day's high, low and close. Standard pivots set P = (H + L + C) ÷ 3 and build levels from P and the range. Fibonacci pivots place levels 38.2%, 61.8% and 100% of the range either side of P. Camarilla pivots cluster tightly around the close using the constant 1.1.
 챕터 3Pivot points cheat sheet.A pivot point is the average of the previous period's high, low and close: P = (H + L + C) ÷ 3. Standard levels come from P and the range, Fibonacci pivots sit 38.2%, 61.8% and 100% of the range from P, and Camarilla levels sit near the previous close. None predicts where price will turn.

