Candlestick patterns cheat sheet.
A candlestick pattern is a shape made by one, two or three candles that hints at who controlled price. Single candles such as the doji, hammer and shooting star show rejection or indecision. Two- and three-candle patterns such as engulfing and morning star show a shift. None predicts price reliably on its own.
เนื้อหานี้ยังมีเฉพาะภาษาอังกฤษ
This page collects every pattern from the candlestick chapter. Each row says only what a pattern suggests, because none tells you what happens next.
What do the four prices of a candle tell you?
Take an hourly EUR/USD candle with illustrative prices: open 1.10200, low 1.10100, high 1.10600, close 1.10500.
The body runs from open to close, 30 pips, bullish because the close is higher. The wicks, or shadows, sit outside it: 10 pips above and 10 below, in a 50 pip range.
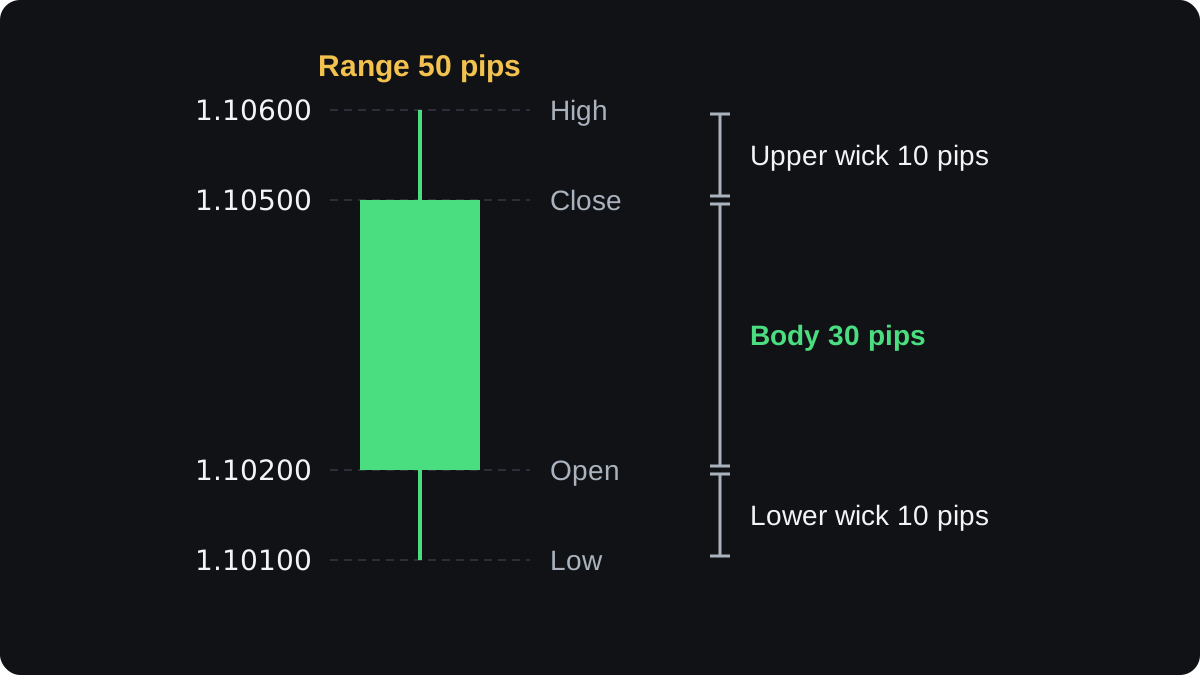
Every pattern compares these numbers. The candlestick reading lesson covers colours and timeframes.
Single-candle patterns at a glance
Single candles depend on body, wicks and position in the move.
| Pattern | Shape | Context | What it suggests |
|---|---|---|---|
| Spinning top | Small body, wicks both sides | Anywhere | Indecision |
| Marubozu | Long body, little or no wick | Anywhere | One side in control |
| Doji | Open and close almost equal | After a long move | Momentum may be fading |
| Hammer | Small body at top, long lower wick | Downtrend | Lower prices pushed back |
| Hanging man | Same shape as a hammer | Uptrend | Selling appeared |
| Inverted hammer | Small body at bottom, long upper wick | Downtrend | Buyers tested higher |
| Shooting star | Same shape as an inverted hammer | Uptrend | Higher prices rejected |
A common rule of thumb for the hammer family is a long wick at least twice the body. The hammer and hanging man lesson explains why trend position changes the name.
Two-candle patterns: engulfing and tweezers
Two candles show whether the second undid the first.
| Pattern | Shape | Context | What it suggests |
|---|---|---|---|
| Bullish engulfing | Bearish candle, then a bullish body covering it | Downtrend | Buyers overwhelmed the prior session |
| Bearish engulfing | Bullish candle, then a bearish body covering it | Uptrend | Sellers overwhelmed the prior session |
| Tweezer bottom | Two candles with matching lows | Downtrend | The same low held twice |
| Tweezer top | Two candles with matching highs | Uptrend | The same high held twice |
Engulfing compares bodies and usually ignores wicks; see the engulfing patterns lesson. Tweezer lows rarely match exactly, so fix a tolerance in advance.
Three-candle patterns and what the third candle adds
The third candle confirms the turn, after part of the move has gone.
| Pattern | Shape | Context | What it suggests |
|---|---|---|---|
| Morning star | Long bearish, small candle below, long bullish into the first body | Downtrend | Selling reversed |
| Evening star | Long bullish, small candle above, long bearish into the first body | Uptrend | Buying reversed |
| Three white soldiers | Three long bullish candles, each closing higher | Downtrend or range | Steady buying |
| Three black crows | Three long bearish candles, each closing lower | Uptrend or range | Steady selling |
| Three inside up | Long bearish, small bullish inside it, bullish close above it | Downtrend | Pause turned to buying |
| Three inside down | Long bullish, small bearish inside it, bearish close below it | Uptrend | Pause turned to selling |
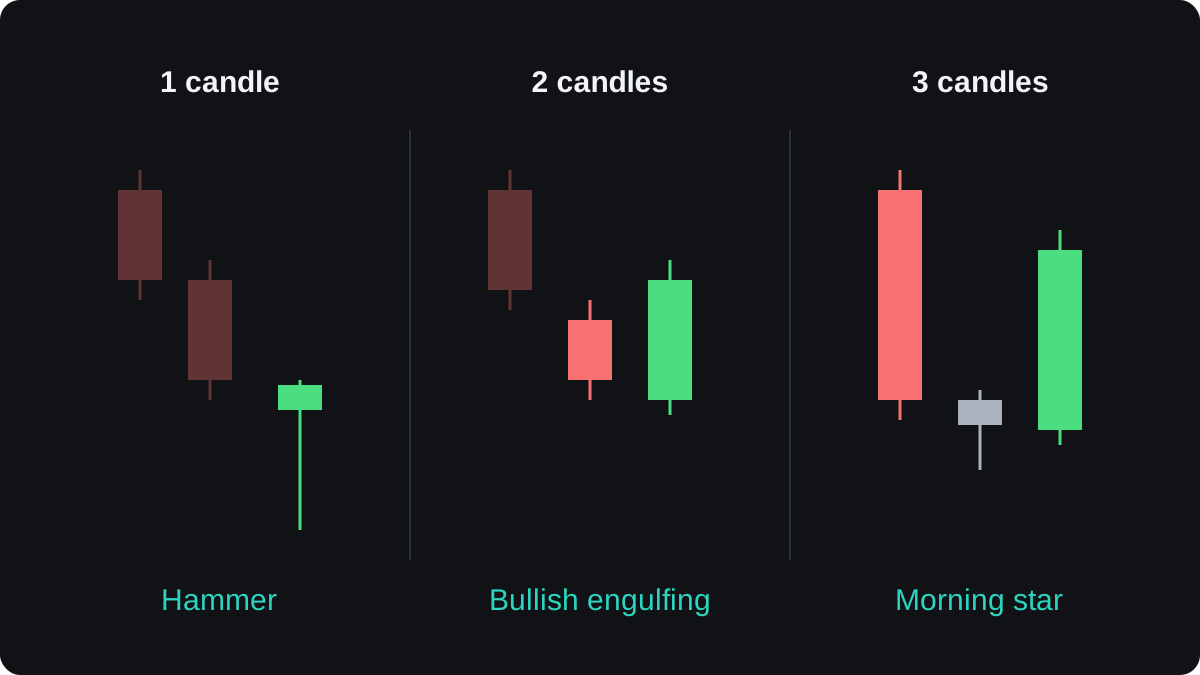
A frequent star rule asks the third candle to close past the first body's midpoint; see the morning star and evening star lesson. A hammer, bullish engulfing and morning star show rejected lower prices across one, two and three candles.
Worked example: checking a hammer on USD/JPY
After a fall, a USD/JPY hourly candle opens at 150.20, drops to 149.70, reaches 150.35 and closes at 150.30. Prices are illustrative; a yen pip is 0.01.
- Body: 150.30 minus 150.20 = 0.10, or 10 pips, bullish.
- Lower wick: 150.20 minus 149.70 = 0.50, or 50 pips.
- Upper wick: 150.35 minus 150.30 = 0.05, or 5 pips.
- Lower wick 50 ÷ 10 = 5 times the body: a hammer, after a decline.
As an example, ignoring the spread, say you buy at 150.30 with a stop at 149.65, 5 pips below the low.
- Stop distance: 150.30 minus 149.65 = 0.65, or 65 pips.
- On 0.10 lot, 10,000 dollars, one pip is 10,000 × 0.01 = ¥100, so the risk is 65 × ¥100 = ¥6,500.
- A dollar account converts near the stop price: ¥6,500 ÷ 149.65 = $43.43.
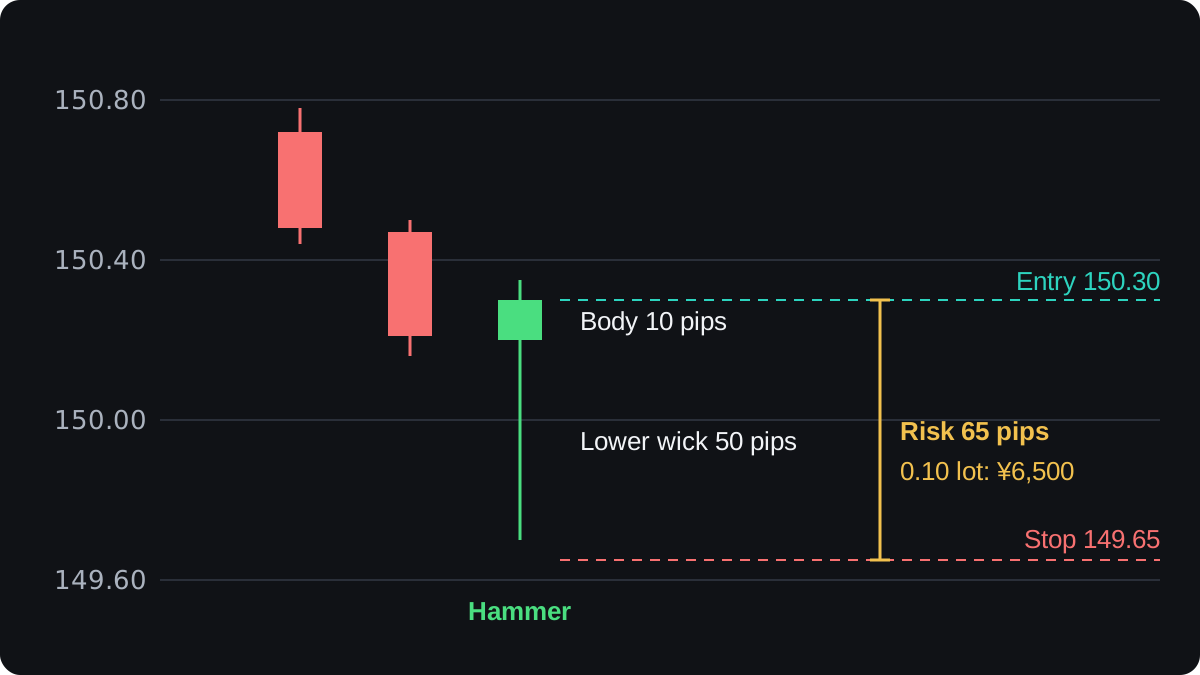
A hammer that measures well can still fail, and fast markets can fill a stop beyond its price. The pip value calculator repeats step 6.
Where candlestick patterns let you down
Evidence that candlestick patterns alone predict forex prices is weak and mixed, and costs can absorb a small edge.
A hammer mid-range means less than one at a level where price turned before, so read patterns with support and resistance.
Forex trades around the clock on weekdays, so star patterns usually have no gaps. Server time sets where daily candles start, so platforms can draw different ones.
Write the rule down and test it first, as the backtesting lesson explains. Fibonacci retracements come next.
คำถามที่พบบ่อย
Which candlestick pattern is the most reliable?
None is reliable on its own. A clear level and a confirming candle add context, but you still need a stop.
What is the difference between a hammer and a hanging man?
The shape is the same, a small body near the top and a long lower wick. A hammer follows a decline and a hanging man a rise.
Do candlestick patterns work in forex?
They describe forex price behaviour, but their power to predict on their own is limited.
What timeframe is best for candlestick patterns?
There is no single best one. Higher timeframes show fewer patterns, each built from more trading.
เรียนต่อ
 บทที่ 2How to read a candlestick.A candlestick shows four prices for one trading period: the open, high, low and close. The thick body runs from open to close, and the thin wicks reach the high and the low. A candle that closed above its open is bullish, usually green, and one that closed below is bearish, usually red.
 บทที่ 2What candle bodies and wicks tell you.A candle's body shows the move from open to close, and its wicks show prices reached but not kept. A long body means price moved far and held it; a short body means open and close ended near each other. A long lower wick shows a drop bought back, and a long upper wick a rise sold off.
 บทที่ 2Spinning tops and marubozu candles.A spinning top is a candle with a small body and wicks on both sides longer than the body, showing that buyers and sellers ended the period roughly even. A marubozu is the opposite: a long body with little or no wick, showing one side controlled the period from open to close. Neither predicts the next move alone.
 บทที่ 2Doji candles and what they signal.A doji is a candle that opens and closes at almost the same price, so its body is a thin line. It shows buyers and sellers ended the period even. The four common types are standard, long-legged, dragonfly and gravestone. A doji alone is a weak signal; context and the next candle matter.
 บทที่ 2Hammer and hanging man patterns.A hammer and a hanging man are the same candle: a small body near the top and a lower wick at least twice as long. After a fall it is a hammer, a hint that selling may be fading. After a rise it is a hanging man, a warning that buying may be tiring. Each needs a confirming next candle.
 บทที่ 2Inverted hammer and shooting star patterns.An inverted hammer and a shooting star are the same candle: a small body near the low and a long upper wick, usually at least twice the body. After a fall it is an inverted hammer, a possible turn up. After a rise it is a shooting star, a possible turn down. Both need a confirming close.
 บทที่ 2Bullish and bearish engulfing patterns.An engulfing pattern is a two-candle reversal signal. A bullish engulfing forms after a decline, when a rising candle's body completely covers the previous falling candle's body. A bearish engulfing is the mirror image after a rise. It suggests control has switched sides, but it often fails in ranges and means more at a support or resistance level.
 บทที่ 2Tweezer tops and bottoms.A tweezer top is two candles, usually side by side, that reach almost the same high after a rise. A tweezer bottom is two candles with almost the same low after a fall. Both show a price the market rejected twice. They mean most at a known level and are weak signals on their own.
 บทที่ 2Morning star and evening star patterns.A morning star is a three-candle pattern at the end of a fall: a long bearish candle, a small-bodied star near the low, then a long bullish candle that closes above the first candle's midpoint. An evening star is the mirror image after a rise. Both suggest a possible reversal, and neither guarantees one.
 บทที่ 2Three white soldiers and three black crows.Three white soldiers is three bullish candles in a row after a decline, each closing higher and near its high. Three black crows is the bearish mirror after a rise. Both suggest one side has taken control, but they often appear after a large move, can fail, and are best read with the trend and a planned stop.
 บทที่ 2Three inside up and three inside down.Three inside up is a three-candle bullish reversal pattern: a long bearish candle, a small bullish candle whose body sits inside it, then a bullish candle that closes above the first candle's open. Three inside down is the mirror image after a rise. Both are a harami plus a confirming candle, and neither is a reliable signal on its own.

