How to draw support and resistance.
To draw support and resistance, find swing highs and lows where price turned at about the same price two or more times, then draw a horizontal line through that cluster. Start on the daily or weekly chart for the main levels, refine them on a 4-hour or 1-hour chart, and keep only the nearest few.
เนื้อหานี้ยังมีเฉพาะภาษาอังกฤษ
A support or resistance line is only as good as the turns it is drawn from. Pick weak swing points and you end up with a chart full of lines that price ignores.
This lesson follows what support and resistance are. It shows how to choose the turns that count and which timeframe to start from.
What are swing highs and swing lows?
Look along a row of candles for one whose high pokes above its neighbours. If the two candles before it and the two after it all have lower highs, that candle marks a swing high.
A swing low is the mirror image: a candle whose low sits below the lows of the candles on both sides. Two candles on each side is a common setting. Some traders use three or more, which gives fewer and larger swings.
In the chart below, a 4-hour EUR/USD chart with illustrative prices, the swing high is at 1.0890 and the swing low is at 1.0850.
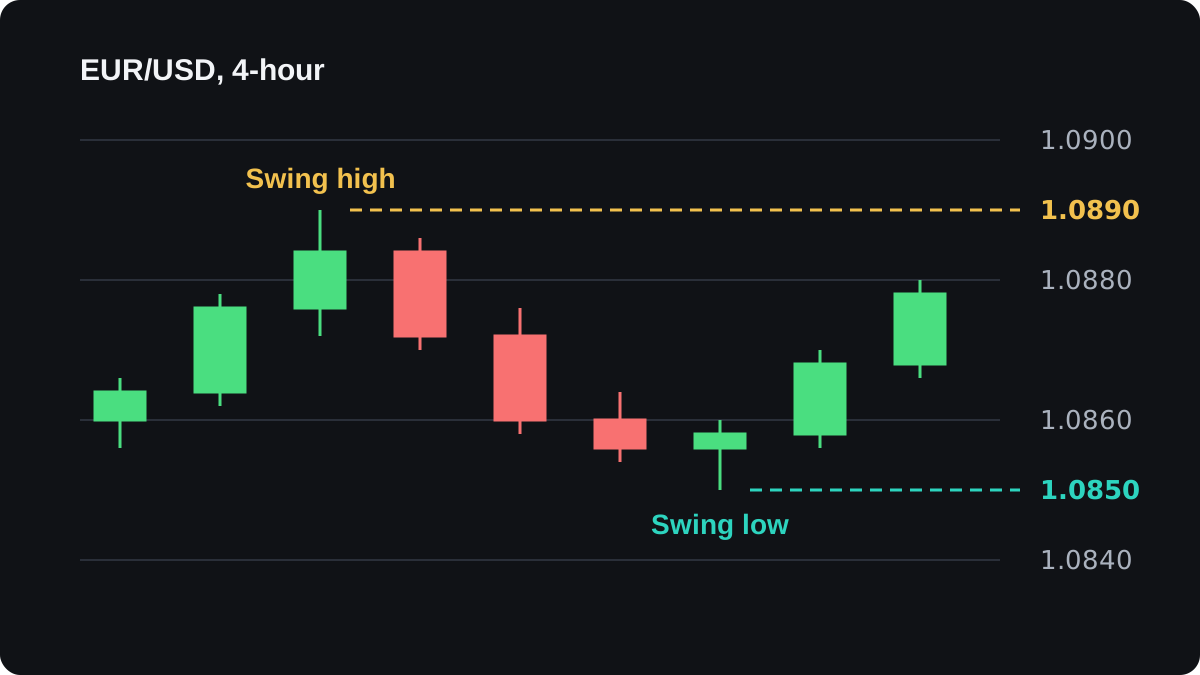
Resistance is drawn from swing highs and support from swing lows. The market structure lesson uses the same points to read trends.
Which swing points deserve a line?
A few months of chart hold dozens of swings, and most of them are small wiggles. These tests help you keep the ones worth drawing:
- Price turned near the same price more than once. Two turns suggest a level, and three or more make it clearer.
- The move away from the turn was large for that chart. A turn followed by 80 pips of movement tells you more than one followed by 10.
- Price reacted there recently. Older levels can still matter, but check that the market respected them on its last few visits.
Here is a cluster with illustrative numbers. A 4-hour EUR/USD chart shows three swing lows over two weeks: 1.0853, 1.0848 and 1.0851.
The highest is 1.0853 and the lowest is 1.0848. The gap is 0.0005, which is 5 pips. Three turns inside 5 pips is a tight cluster, so you would draw support at about 1.0850.
A single sharp swing with nothing near it is weaker evidence. Mark it lightly, if at all, and wait to see whether price turns there a second time.
How do you draw the line, step by step?
The same routine works on any pair:
- Open a daily chart and zoom out until you can see roughly six months to a year of price.
- Mark the obvious swing highs and lows, the turns you would notice without searching.
- Look for two or more turns at about the same price. Those clusters are your candidates.
- Draw a horizontal line through each cluster. Above the current price it is resistance, and below it is support.
- Switch to a 4-hour chart and nudge each line to where the turns sit most tightly.
Each turn gives you two prices to choose from: the tip of the wick and the edge of the body. The candlestick lesson explains both parts.
Some traders draw through wicks, because that is how far price actually went. Others draw through bodies, because the open and close show where each period settled. Neither is a rule, so pick one method and use it every time.
Take three illustrative turns on a daily USD/JPY chart. The wicks reached 151.80, 151.95 and 151.70. The candle bodies topped out at 151.40, 151.55 and 151.35.
On yen pairs a pip is 0.01. The highest wick minus the lowest body top is 151.95 minus 151.35 = 0.60, which is 60 pips.
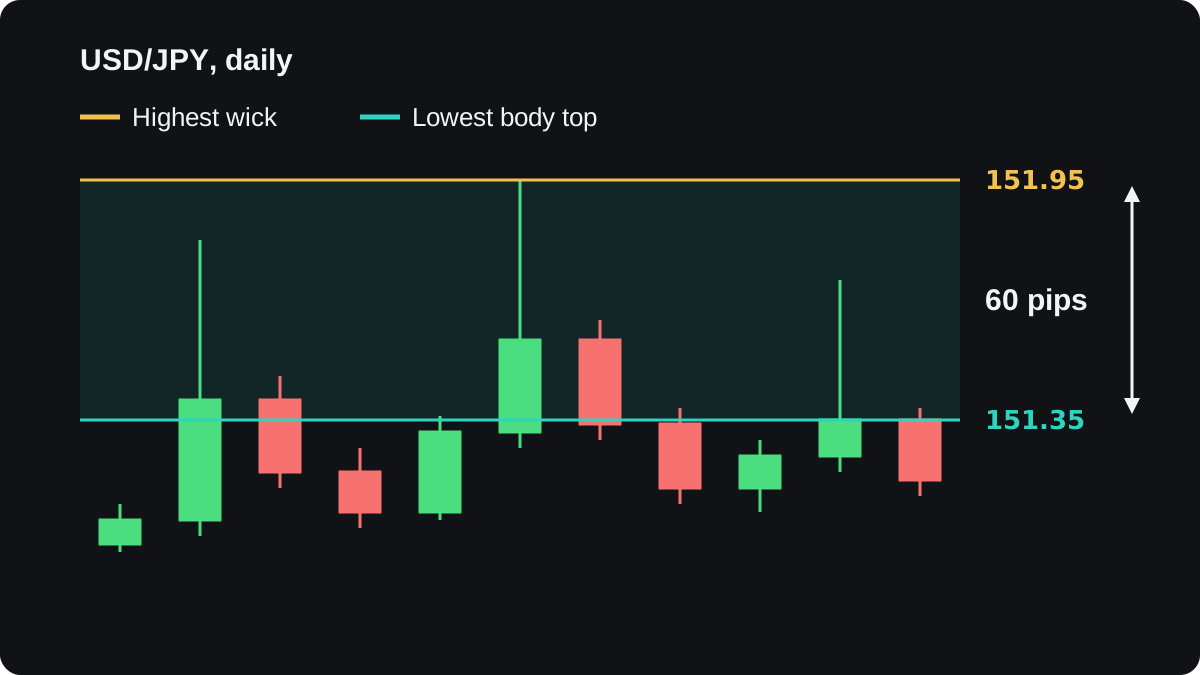
Sixty pips is too wide to call one price. That gap is the reason the next lesson treats every level as a zone with a top and a bottom.
Which timeframe should you draw levels on?
Start high and work down. A level on a weekly or daily chart took weeks or months of trading to form. A level on a 5-minute chart may have formed in under an hour.
Levels from higher timeframes tend to get more attention and break less easily. That is a rule of thumb with thin evidence behind it, so test it on your own charts.
These look-back windows are rough starting points, and traders vary them:
| Timeframe | Look back about | Use it for |
|---|---|---|
| Weekly | 1 to 3 years | The largest turning points |
| Daily | 6 to 12 months | Main support and resistance |
| 4-hour | 1 to 3 months | Refining daily levels |
| 1-hour | 1 to 3 weeks | Minor levels between daily ones |
Here is how the layers fit, with illustrative EUR/USD prices. The daily chart gives support at 1.0850 and resistance at 1.0950, which is 0.0100 apart, or 100 pips. The 1-hour chart adds minor levels at 1.0880, 1.0905 and 1.0925.
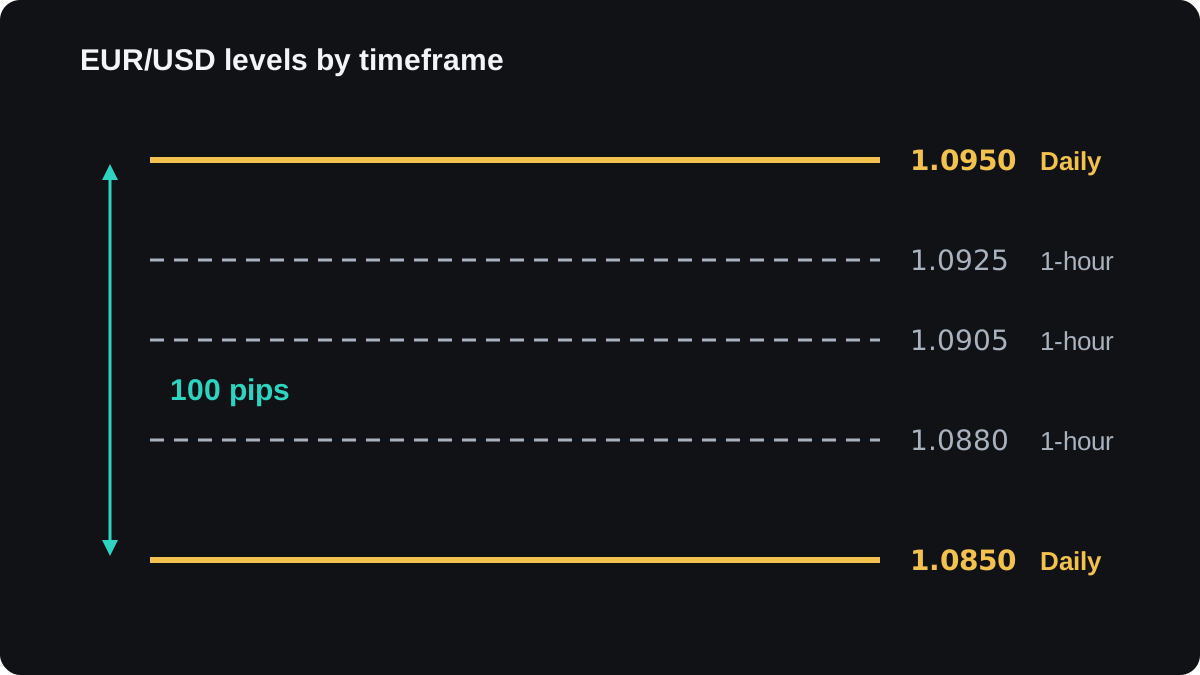
Read the daily lines as the frame and the 1-hour lines as detail inside it. When the two disagree, give the daily level more weight.
How low you go depends on how long you hold trades. A swing trader may stop at the 4-hour chart, and a day trader may drop to the 1-hour or 15-minute. Top-down analysis walks through the whole process.
How many lines should your chart have?
If a line sits every 15 pips, price is always near one and the lines stop telling you anything. One or two levels above the current price and one or two below are usually enough.
Delete a line once price has crossed it several times without reacting. A level that price broke cleanly is different: it can switch roles, so old support may be tested later as resistance.
Redraw as the market moves. A level from six months ago can still be valid, but check each line against recent price before you rely on it.
Where drawn levels go wrong
Levels look convincing on old charts because you choose the turns after the fact. You notice the touches that held and skip the ones that failed, which makes every line look stronger than it was.
Two traders can look at the same chart and draw different lines, because a level is only a price where past turns happened to cluster.
The evidence that these levels hold more often than chance is limited and mixed. So treat a level as a place to watch, and decide in advance what you will do if price cuts straight through it.
That plan usually means a stop loss placed beyond the level, with room for the wicks you measured. Practising on a demo account first lets you check later which of your lines price respected.
คำถามที่พบบ่อย
Should I draw support and resistance on wicks or bodies?
Either works if you stay consistent. When wicks and bodies are far apart, draw a zone that covers both instead of choosing one line.
How many touches make a valid level?
Two turns at about the same price suggest a level, and three or more make it clearer. No number of touches guarantees that price will react next time.
What is the best timeframe for support and resistance?
Start on the weekly or daily chart to find the main levels, then refine them on the 4-hour or 1-hour chart. The lowest timeframe you use should match how long you hold trades.
Are round numbers like 1.1000 support and resistance?
Prices such as 1.1000 or 150.00 are easy to remember, and turns sometimes cluster near them. Treat a round number as one more reason to watch a price, and still check the chart for real turns there.
Why does price keep breaking my levels?
A level only records where price turned before, and it carries no promise. Lines drawn from a single swing or on very low timeframes tend to break more easily, and every level gives way eventually.
เรียนต่อ
 บทที่ 1What are support and resistance levels?Support is a price area where falling prices have stopped and turned up more than once, because buyers stepped in there. Resistance is the opposite: an area where rises have stalled because sellers took over. Traders use both to plan entries, stops and targets, but any level can break, so none is a guarantee.
 บทที่ 1Why support and resistance are zones, not lines.Price rarely turns at one exact number, because orders spread out around a level and price feeds differ slightly between brokers. Treat support and resistance as a zone: a band from the bodies to the wicks of past reactions. Put your stop beyond the far edge, then size the trade so the risk stays fixed.
 บทที่ 1When support becomes resistance.When price breaks through a support level, that level often acts as resistance when price returns to it, and broken resistance often turns into support. The return visit is called a retest. Traders watch for a candle that reaches into the old zone and closes back on the break side, though the flip can fail.
 บทที่ 1How to draw a trend line.To draw an uptrend line, connect two or more rising swing lows and extend the line to the right. For a downtrend, connect falling swing highs. Two points draw the line, a third reaction is the usual sign it is confirmed, and a candle closing clearly beyond it usually means the line has stopped counting.
 บทที่ 1Price channels and how to trade them.A price channel is two parallel lines that contain a trend: a trend line along the swing lows or highs and a copy on the other side. Near the lower edge a buy aims for the upper edge, and the reverse at the top. A close outside either line can mean the channel has ended.
 บทที่ 1Trading the bounce or the break.Trading the bounce means buying near support or selling near resistance while the level holds, with a stop just beyond it. Trading the break means entering after price closes through the level, with a stop back inside the old range. Bounce trades fail when the level breaks; break trades fail on false breakouts.
 บทที่ 1Support and resistance cheat sheet.Support is a price area where falls have stopped before, and resistance is one where rises have stopped. Mark them as zones from clear swing highs and lows, expect broken levels to swap roles, and plan every bounce or break with a stop beyond the zone. Levels show where to watch, and any of them can break.

