Key levels for price action traders.
Key levels are the few prices where the market has clearly turned before, such as higher-timeframe swing highs and lows, the previous day's and week's high and low, and round numbers. Marking about two above price and two below, as zones, shows you where to pay attention and where a trade has room to move.
เนื้อหานี้ยังมีเฉพาะภาษาอังกฤษ

Open a chart that someone has marked up for a month and you often find fifteen or twenty horizontal lines. Price is always touching one of them, so the lines tell you very little.
Price action traders mark far fewer levels. They keep the prices where the market clearly turned before, and they ignore the rest until price gets there.
What makes a level worth marking?
Picture EUR/USD falling to 1.08000 and bouncing 70 pips to 1.08700. Days later it falls back to 1.08000 and bounces 70 pips again. Buyers stepped in at the same price twice, and that is worth remembering.
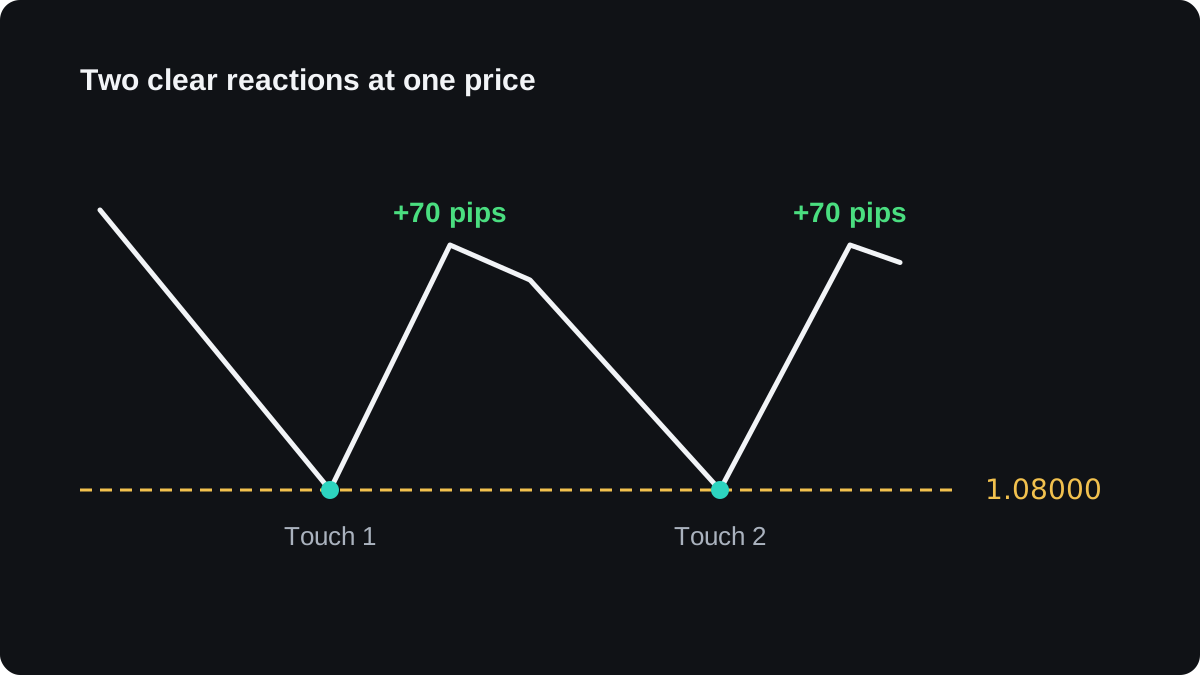
A key level is a price where the market has reacted strongly before and may react again when it returns. The strength of the reaction matters more than the exact line, because a fast move away suggests sizeable orders were waiting there.
A level earns a place on your chart when it passes some of these checks:
- Price moved away from it quickly and far, compared with the usual swings on that chart.
- Price has reacted to it more than once.
- It is visible on a higher timeframe, such as the daily or weekly chart.
- It is recent enough that the market around it still looks similar.
When several reasons point at the same price, traders call it confluence. A level with confluence deserves more attention, though it can still break.
Mark each level as a band a few pips wide, because price rarely turns on the exact same pip twice. The lesson on support and resistance zones shows how to choose that width.
Where do the best levels come from?
Most useful levels come from a short list of places. Start with the first and work down.
- Swing highs and swing lows on a higher timeframe. These are the turning points from the market structure lesson, read on the daily or 4-hour chart.
- The previous day's and previous week's high and low. Anyone can see them on any platform, so they are widely watched.
- Round numbers, such as 1.08000 or 1.10000 on EUR/USD and 150.00 on USD/JPY.
- Old levels that have flipped. Support that breaks often becomes resistance later, which the lesson on role reversal covers.
- The top and bottom of a sideways range.
The daily high and low depend on when your broker's daily candle closes. Many brokers set server time so the day ends at 17:00 New York time, but not all do, so check your platform.
Round numbers have some basis. Research on bank order books has found take-profit orders bunching at round prices and stop orders bunching just beyond them. That gives you a reason to watch them, though it does not make a turn there likely on its own.
A round number by itself is a weak level. A round number that also matches last week's low is one worth marking.
Why do fewer lines make clearer decisions?
Say EUR/USD moves about 80 pips on a normal day, a round figure used only for illustration. With a line every 10 pips, price crosses about eight of them each day.
At that density, every move starts or stops at some line. You can explain any trade afterwards, and the lines give you no help choosing one beforehand.
Now picture the same price path with two levels 100 pips apart. Price reaches one only now and then. When it does, you know to watch closely, and in the space between you can wait.
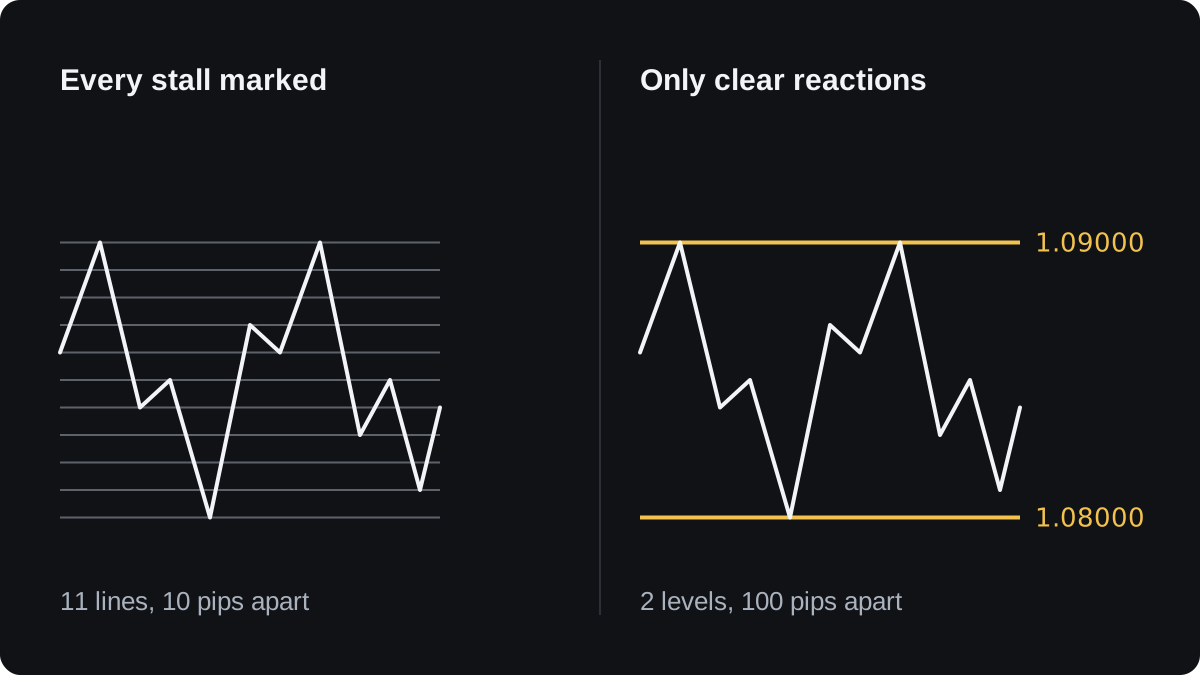
A workable habit is two levels above price and two below on the chart you trade. When you want to add a fifth, delete the weakest one first.
Old lines that price has cut through several times without reacting should go too, since a level that no longer moves the market only adds clutter.
How do you mark levels step by step?
Work from the larger timeframe down, as in top-down analysis, so the strongest levels go on first.
- Open the weekly chart and mark the two or three clearest swing highs and lows near current price.
- Move to the daily chart. Add the previous week's high and low and any daily swing point with a sharp reaction.
- Note round numbers that sit inside or close to those zones.
- Keep the two zones nearest above price and the two nearest below. Hide the others.
- Drop to the chart you trade on and check that each zone still looks clear there.
Redo this once a day or once a week, depending on how long you hold trades. Levels go stale as price moves on.
How do levels show whether a trade has room?
Levels help most when you plan where a trade could fail and where it could stop. Take EUR/USD with illustrative prices: a resistance zone from 1.08950 to 1.09000 and a support zone from 1.08000 to 1.08050.
You want to buy. Your stop goes at 1.07950, just under the support zone, and your target at 1.08940, just under resistance. Compare two entries.
Entry A at 1.08400, in the middle of the range:
- Risk: 1.08400 minus 1.07950 = 0.00450, which is 45 pips.
- Reward: 1.08940 minus 1.08400 = 0.00540, which is 54 pips.
- Reward to risk: 54 ÷ 45 = 1.2 to 1.
Entry B at 1.08100, just above support:
- Risk: 1.08100 minus 1.07950 = 0.00150, which is 15 pips.
- Reward: 1.08940 minus 1.08100 = 0.00840, which is 84 pips.
- Reward to risk: 84 ÷ 15 = 5.6 to 1.
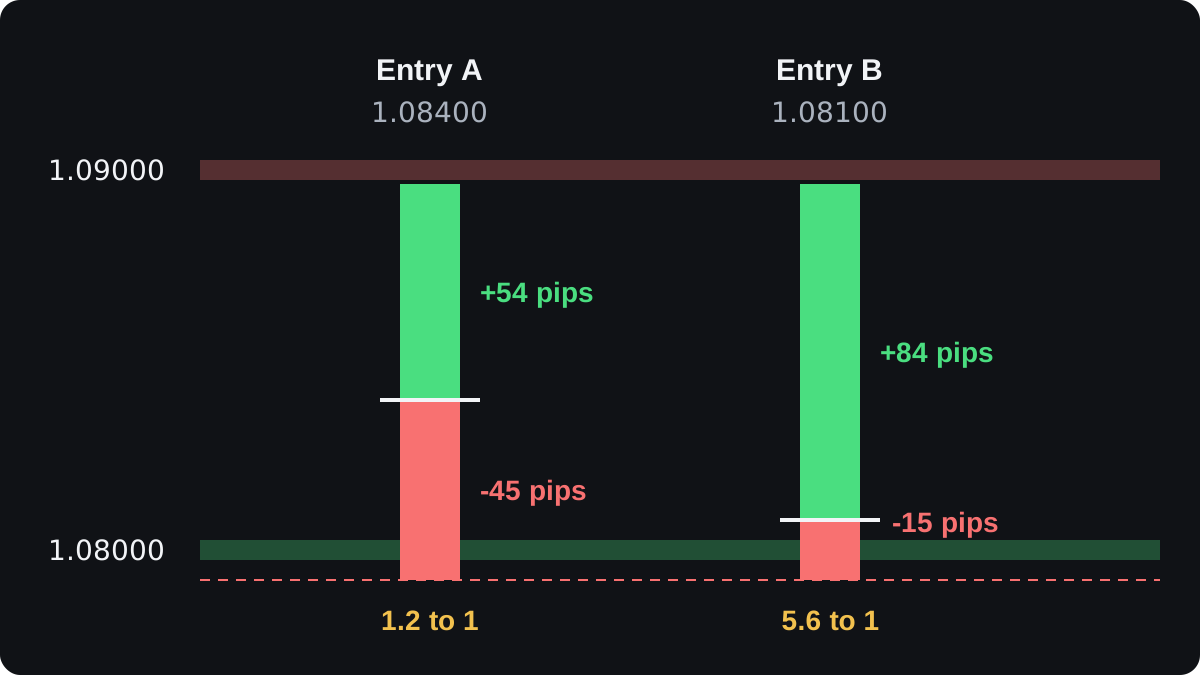
On 0.10 lot of EUR/USD a pip is worth $1, so the money follows the pips directly:
| Entry | Risk | Reward | Ratio |
|---|---|---|---|
| A at 1.08400 | 45 pips, $45 | 54 pips, $54 | 1.2 to 1 |
| B at 1.08100 | 15 pips, $15 | 84 pips, $84 | 5.6 to 1 |
These sums leave out the spread and any commission, which would shrink each reward slightly.
Entry B looks better on paper, yet it has drawbacks. Price may never come back to 1.08100, and a 15 pip stop is easier for ordinary noise to reach. The risk-reward lesson explains why a ratio says nothing about how often a trade wins.
Where do key levels fail?
Levels are drawn by people, so two traders looking at the same chart will often mark different prices. There is no single correct set.
Price can slice through a strong level with no pause, especially around major economic releases. It can also poke past a level, trigger stops and return, which the lesson on false breakouts covers.
Hindsight also misleads. On a finished chart, the levels that held are easy to see and the ones that failed fade from memory, so a level can look more reliable than it was.
Treat a level as a place to watch, with no promise attached. What price does when it gets there is the subject of the next lesson, candle signals at key levels.
คำถามที่พบบ่อย
How many key levels should I draw on a chart?
A workable limit is two above price and two below on the chart you trade, taken mostly from the daily and weekly charts. More lines than that make almost every price look like a level.
Are round numbers support and resistance?
They can be, because orders tend to gather near them. A round number on its own is weak, so give it more weight when it lines up with a swing point or last week's high or low.
Is a key level a line or a zone?
Treat it as a zone a few pips wide. Price rarely turns at the same pip twice, and a zone stops you from calling a small overshoot a break.
Which timeframe gives the strongest levels?
Levels from the daily and weekly charts cover more history and are visible to traders on every timeframe, so they are usually the ones to mark first. They still break, so treat them as places to watch.
เรียนต่อ
 บทที่ 1What is price action trading?Price action trading means deciding when to buy or sell from the price chart itself: the swing highs and lows, the levels where price turned before and the candles that form at those levels. It uses few or no indicators, but it still needs written rules, a stop loss and testing, because reading a chart is partly subjective.
 บทที่ 1Market structure: swing highs and swing lows.A swing high is a peak with lower highs on both sides, and a swing low is a trough with higher lows on both sides. An uptrend makes higher highs and higher lows; a downtrend makes lower highs and lower lows. A break of structure is price moving beyond the last swing point that defined that trend.
 บทที่ 1Candle signals at key levels.A candle signal is a candle whose shape tells you how buyers and sellers behaved at a price. Pin bars, inside bars and engulfing candles carry more weight at a support or resistance level you marked in advance, in the direction of the wider structure. Away from a level they mean little, and even at one they can fail.

