Technical, fundamental or sentiment: which should you use?
No single approach is best. Fundamental analysis suggests which way a currency should drift, sentiment shows whether that view is already crowded, and technical analysis sets the entry, stop and target. You can use all three in that order, from the slow view to the fast one, and keep each chart to one tool per question.
เนื้อหานี้ยังมีเฉพาะภาษาอังกฤษ

Two traders can watch the same rise in EUR/USD and explain it differently. One points to a change in what markets expect from interest rates. The other points to a break above a price that had capped the pair twice.
Both explanations can be true at once. They describe different parts of the same move, which is why the three schools in the three ways to analyse the forex market are easier to use together than to rank.
Is one type of analysis better than the others?
None of them has strong evidence of beating the market on its own.
Since the early 1980s, economists have found that models built on economic data struggle to forecast exchange rates better than a simple guess of no change, at horizons up to about a year.
Studies of simple chart rules in currencies show mixed results. Some rules that looked profitable in older data did worse in later years, and trading costs shrink what is left.
Sentiment has its own gap. A crowded position can stay crowded for weeks before it turns, and positioning data does not tell you when the turn will come.
Each approach is better suited to a different job, so a more useful question is which job you are doing right now.
What question does each approach answer?
Fundamental analysis looks at the economy behind a currency: interest rates, inflation, growth and central bank policy. Its output is a bias, a view of which way a pair should drift over weeks or months.
Sentiment analysis measures how other traders are positioned and how much risk they want to take. It tells you whether a view is already shared by so many people that few new buyers or sellers are left.
Technical analysis studies the price chart itself. It supplies the levels: where to enter, where your idea is proven wrong, and where to take profit.
| Approach | Question it answers | Typical inputs | Main weakness |
|---|---|---|---|
| Fundamental | Which way, and why? | Interest rates, inflation, jobs data, central bank statements | Slow, and the news may already be in the price |
| Sentiment | How crowded is the trade? | Commitments of Traders report, broker positioning data, risk mood | Extremes can last a long time |
| Technical | Where and when? | Price, support and resistance, trend, indicators | Signals fail often, and levels are drawn by eye |
One way to use them is in that order, from slow to fast. The fundamental view picks a direction, the sentiment check can veto it, and the chart decides the exact prices.
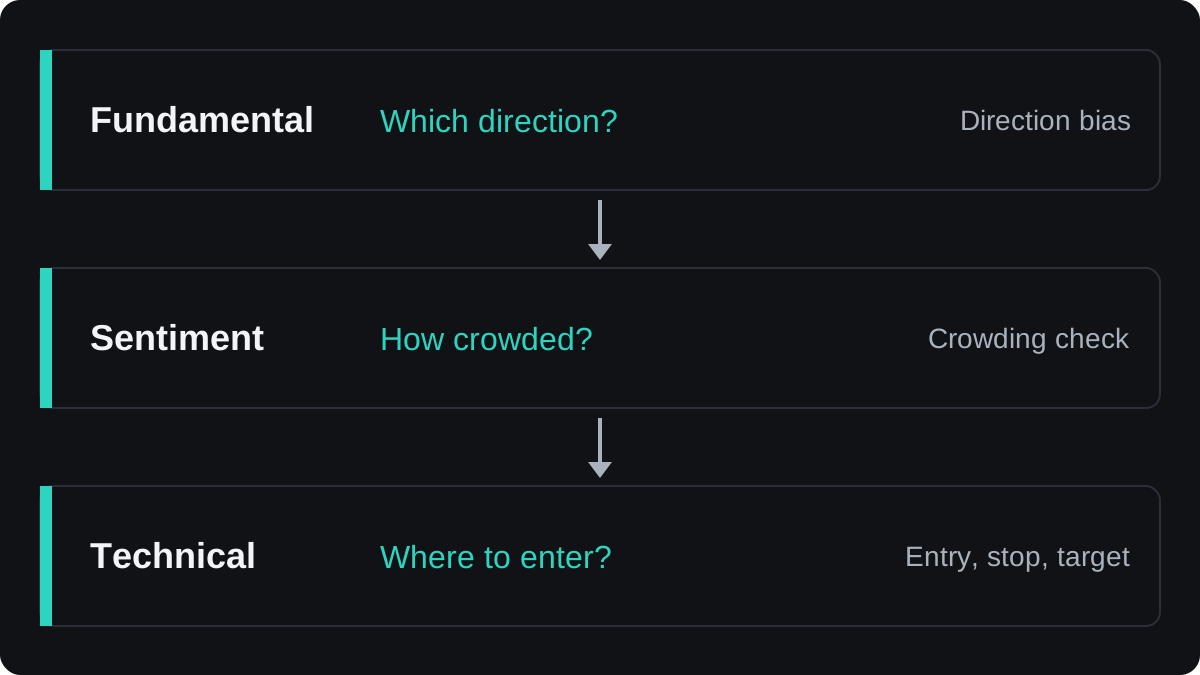
How do the three fit together on one trade?
Here is the process on one EUR/USD trade. Every number is illustrative and chosen to make the arithmetic easy, so treat the trade as a demonstration of the method and nothing more.
- Start with the fundamental bias. Suppose the European Central Bank is expected to hold rates while the US Federal Reserve is expected to cut. A rate gap moving in the euro's favour tends to support EUR/USD, unless markets have already priced it in, so your bias is to look for buys.
- Check sentiment next. Suppose the latest Commitments of Traders report shows speculators only moderately long the euro, well short of past extremes. The trade does not look crowded, so sentiment raises no warning.
- Look at the economic calendar. Suppose no major release for either currency is due in the next day, so a scheduled number is unlikely to jump the price while you enter.
- Use the chart for timing. Price has fallen into a support zone around 1.08000 and bounced. You buy at 1.08200, place the stop at 1.07900 below the zone, and set a target at 1.08800.
- Measure the distances. The stop is 1.08200 minus 1.07900 = 0.00300, or 30 pips. The target is 1.08800 minus 1.08200 = 0.00600, or 60 pips, twice the risk.
Now size the trade. With a $5,000 account and a plan to risk 1% per trade, the most you can lose is $50. Divide by the 30 pip stop: $50 ÷ 30 = $1.67 per pip.
On EUR/USD one standard lot is worth $10 a pip, so $1.67 a pip needs about 0.167 lot. Round down to 0.16 lot, where a pip is worth $1.60.
The stop now costs 30 × $1.60 = $48, and the target pays 60 × $1.60 = $96. The position size lesson repeats this step for other pairs.
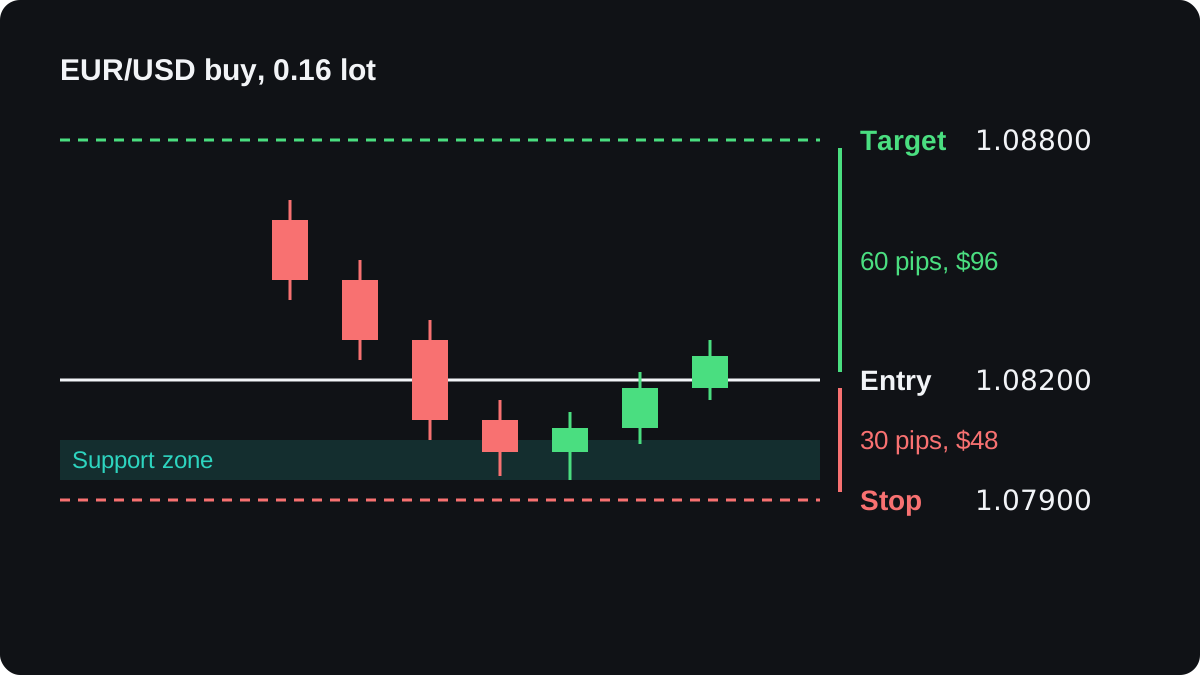
These sums leave out the spread and any commission, which make the real loss slightly larger and the real gain slightly smaller.
Each layer had a job, and none of them predicted the result. If the price falls to 1.07900, you lose $48 however sound the fundamental case looked.
How do you combine indicators without crowding the chart?
Every indicator is calculated from the same prices. RSI, the stochastic oscillator and CCI (the Commodity Channel Index) all measure momentum, so they tend to rise and fall together.
Put all three on a chart and they will often agree. That agreement is one reading shown three times, and it can make a weak signal look stronger than it is.
A leaner chart uses one tool per question: one for trend, such as a 50 period exponential moving average (EMA), one for momentum, such as RSI, and the price levels you drew yourself. The lesson on combining indicators goes further.
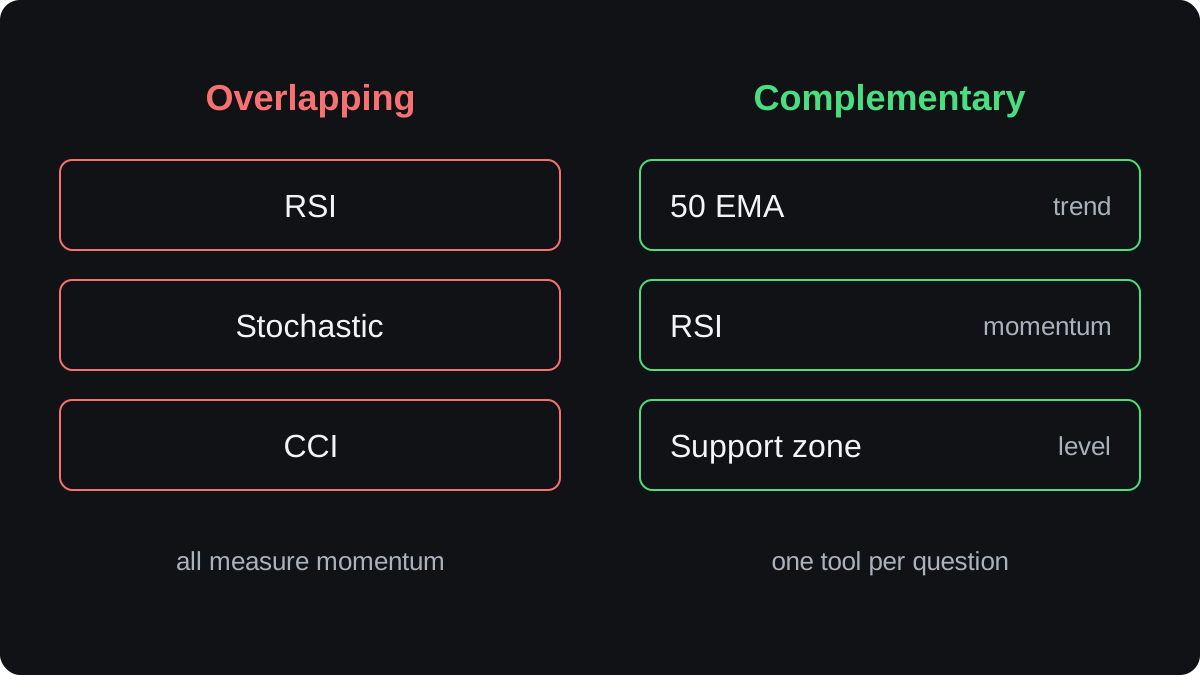
Fundamentals and sentiment need no space on the chart at all. A one line note above your levels carries them, for example "bias long, positioning neutral, no news today".
How should your trading style change the mix?
The time you hold a trade decides how much each approach can help. A scalper holding for minutes leans almost entirely on the chart, because a rate decision expected next month barely matters in that window.
Even a scalper needs the calendar. A surprise in a major release can move a pair tens of pips in seconds, enough to jump past a tight stop.
A swing trader holding for days to weeks has the most reason to use all three. Those trades last long enough for economic news and shifts in positioning to move the price.
A position trader holding for months usually puts the most weight on fundamentals. The chart still matters, because a sound view entered at a poor price can sit in a loss for a long time.
What if the approaches disagree?
Sometimes the fundamental bias says up while the chart keeps making lower lows. Neither view is wrong by definition: the economy may be shifting slowly while short term traders keep selling.
You can stand aside until the two line up, trade a smaller size, or follow one view and accept the risk the other points to.
One rule you could write into a plan is to take chart signals only when they agree with your bias.
It cuts the number of trades and carries no guarantee of better results, so test it on past data and a demo account before you rely on it.
คำถามที่พบบ่อย
Which type of analysis should a beginner learn first?
Technical analysis is usually the easiest place to start, because the chart is on every platform and the basic tools are quick to learn. Check the economic calendar from day one, and build fundamental and sentiment knowledge over time.
Can you trade forex with technical analysis alone?
Yes, and on short timeframes the chart does most of the work. You still need to know when major releases are due, because a surprise can move price straight through the levels you drew.
How many indicators should you use?
There is no fixed number, but each one should answer a different question. Two or three tools covering trend, momentum and levels tell you more than five that all measure momentum.
Is sentiment analysis reliable?
It is most useful as a warning. Extreme positioning shows a trade is crowded, but it can stay crowded for a long time, so pair it with a price signal before acting on it.
Do fundamental traders need charts?
Charts help them too. A chart shows where to enter and where the view is proven wrong, so a sound idea does not start with a large loss.
เรียนต่อ
 บทที่ 2The three ways to analyse the forex market.Forex traders analyse the market in three ways. Technical analysis reads price charts to ask what price has done. Fundamental analysis reads economic data and interest rates to ask why a currency might move. Sentiment analysis reads trader positioning to ask how the crowd is leaning. Each answers a different question and fails in its own way.
 บทที่ 2What is technical analysis?Technical analysis is the study of past price movements, usually on a chart, to judge which way price may move next and to plan entries and exits. Traders look for trends, support and resistance levels, patterns and indicators. It helps with timing and risk planning, but it cannot predict price reliably.
 บทที่ 2What is fundamental analysis?Fundamental analysis judges a currency by the economy behind it: interest rates, inflation, growth, jobs and government policy. In forex it always compares two economies, because a pair prices one currency in another. Prices react most to surprises against forecasts, and the method is better at explaining direction over months than at timing trades.
 บทที่ 2What is sentiment analysis in forex?Sentiment analysis measures how other traders are positioned, such as the share of a broker's clients who are long or short a pair, or speculators' net futures positions in the weekly COT report. It is often read as a contrarian signal, because a crowded trade can unwind, but positioning says little about timing.

