Does the economy drive crypto prices?
Partly. Interest rates, the amount of money in the financial system, investors' appetite for risk and the US dollar all reach crypto prices, often through the same channels that move technology shares. How strong those links are changes over time, and crypto's own events, such as hacks or new products, can outweigh them for months.
Nội dung này hiện chỉ có bản tiếng Anh.

Say the US central bank raises interest rates more than markets expected. Shares fall, the dollar rises and coins drop with them, though no blockchain changed. A year later, a similar surprise might barely move crypto.
Macro, short for macroeconomics, is the economy-wide picture: interest rates, inflation, growth, the money supply and currencies. This lesson explains how it reaches crypto, and why the strength of that link keeps changing.
Why would the economy matter to a coin?
Interest rates mean nothing to a blockchain, yet they matter to the people who buy coins. Those buyers compare crypto with everything else they could hold, and many of them borrow to trade.
Both of those decisions depend on the economy. Four channels carry most of the effect: interest rates, liquidity, risk appetite and the US dollar. Crypto's own news runs alongside them and can outweigh them.
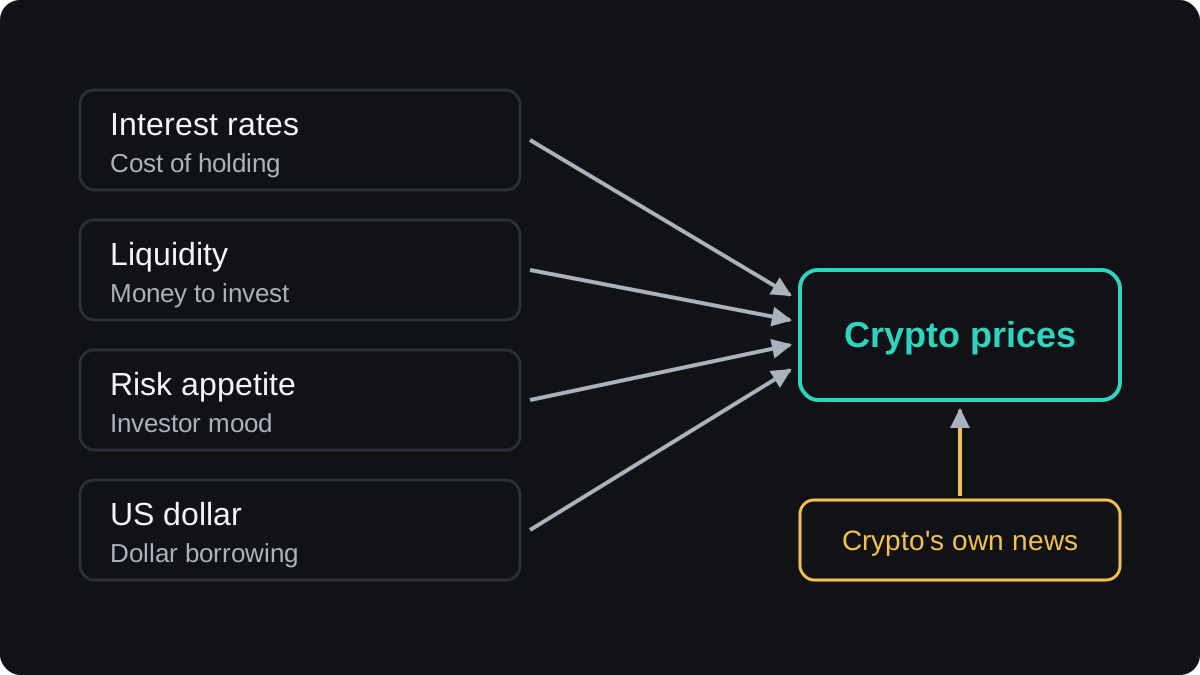
How do interest rates reach crypto?
Most coins pay no interest, so holding them has a cost. With illustrative rates, if cash in a savings account pays 1%, keeping $10,000 in a coin gives up $100 a year. At 5% it gives up $500.
Higher rates therefore raise the price of waiting for a coin to rise. Some money moves to cash and short-term bonds, which now pay more with little price risk.
Rates also set the cost of borrowing, and much crypto trading runs on borrowed money. When borrowing costs more, fewer traders tend to hold large leveraged positions, and that removes a source of buying.
There is a third route. Higher rates make money expected far in the future worth less today, which weighs on anything valued on long-term hopes, from young technology firms to most tokens.
Markets move on expected rates more than on today's rate, so surprises count most. The forex lesson on interest rates and currencies shows how to read expectations.
The economic calendar lists when rate decisions and inflation data are due.
What does liquidity mean for crypto?
Liquidity in the macro sense is how much money is available to invest and how easily it can be borrowed. Central banks add to it when they cut rates or buy bonds, and drain it when they do the reverse.
When money is plentiful, some of it looks for higher returns and reaches speculative assets such as crypto.
In 2020 and 2021, central banks added money at a fast pace and crypto rose strongly. In 2022 they reversed course, and crypto fell hard.
Those years fit the story only loosely. Crypto peaked late in 2021, months before the first US rate rise, and the collapse of several large crypto firms in 2022 deepened the fall.
The forex lesson on global liquidity explains how traders watch it.
Crypto also has a liquidity gauge of its own: the supply of stablecoins. Stablecoins have mostly been used to trade other crypto assets, so a growing supply is often read as new money ready to buy coins.
It is a rough gauge. Stablecoins are also used for payments and transfers, so not every new one is waiting to buy crypto.
How does risk appetite tie crypto to shares?
When investors feel confident, they buy riskier assets. When they are frightened, they sell them for cash and safer bonds.
The forex lesson on risk-on and risk-off describes these moods. Crypto has usually sat at the risky end of the range.
Products such as spot Bitcoin ETFs put coins in the same brokerage accounts as shares. When those investors cut risk, they may sell both at once.
Traders measure the link with beta: how far a coin has moved, on average, for each 1% move in a stock index.
In this illustration, a coin with a beta of 2.5 points to a 7.5% fall, on average, on a day the index drops 3%.
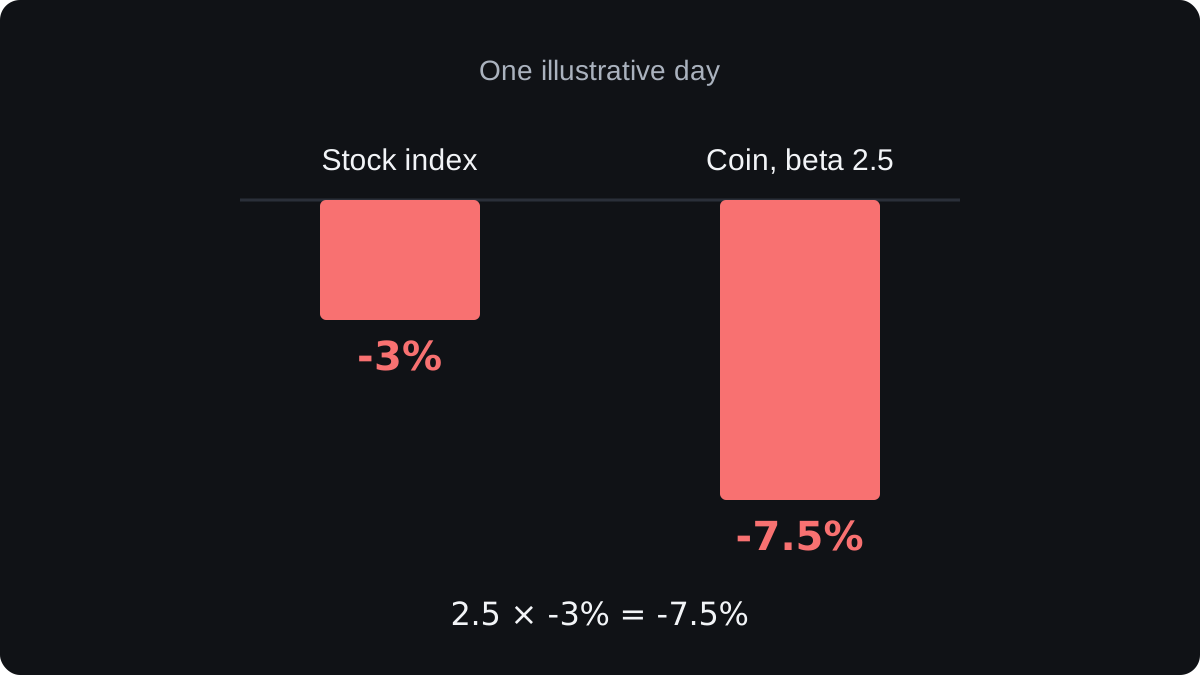
On any single day the coin can move far more or less than that, because beta is an average over many days.
Beta also comes from past data and drifts. Treat it as a description of recent months, and work it out again before you rely on it.
Why does the US dollar matter?
Most coins are priced in US dollars, and much of the world's borrowing is in dollars too.
A stronger dollar makes that debt harder to repay outside the US. Money gets tighter worldwide, and demand for risky assets tends to cool.
You can follow the dollar's overall strength with the US dollar index. A rising index and falling crypto have gone together in some periods, and in others the two moved apart.
Why does the link keep changing?
Traders check the strength of a link with correlation, a number from 1 for moving together to minus 1 for moving in opposite directions.
They measure it over a rolling window, such as the last 90 days. The forex lesson on currency correlation explains the calculation.
Here is an illustrative series of 90-day correlations between a coin and a stock index across five periods: 0.6, 0.4, 0.1, minus 0.2 and 0.5.
At 0.6 the two tended to move together, often on the same macro news. Near zero and below, the coin followed drivers of its own.
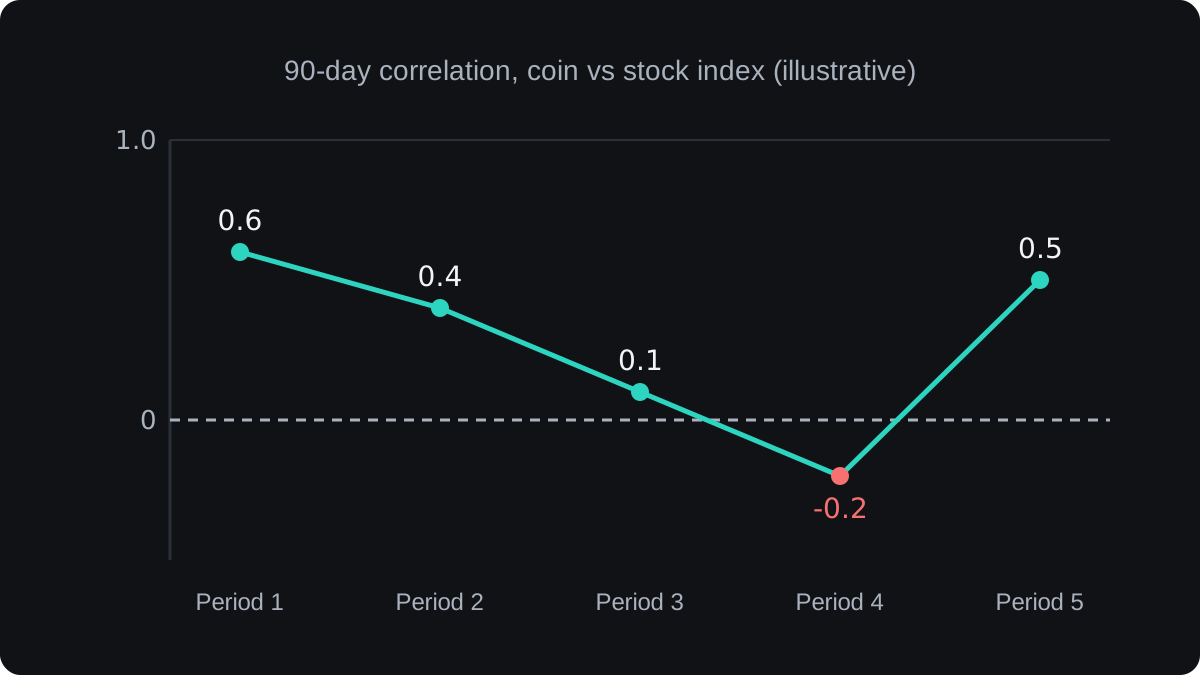
Crypto's own events can cause those breaks. A halving, a new product, a large hack or a court ruling can swamp the macro signal for months.
The inflation story shows how loose these links are. Bitcoin's capped supply is the basis of the claim that it protects against inflation, yet in 2022, with inflation high, it fell alongside shares.
Treat any macro link as a reading you check again every few weeks. The same news can move crypto a lot in one year and hardly at all in the next.
Câu hỏi thường gặp
Is Bitcoin a hedge against inflation?
Its capped supply is the basis of that idea, yet its price has not tracked inflation consistently. In 2022, with inflation high, it fell alongside shares.
Why does crypto often fall when interest rates rise?
Higher rates make cash pay more, raise the cost of borrowing and lower the value of long-term hopes. Each tends to pull money away from risky assets such as crypto, though crypto's own news can outweigh them.
Does crypto move with the stock market?
At times closely, and at times hardly at all. Measure the correlation over recent months instead of assuming it holds.
Which economic data matters most for crypto?
In recent years, mainly data that shifts what markets expect from interest rates, such as US inflation figures, jobs reports and central bank decisions. Prices react to the gap between result and forecast, and that list can change.
Học tiếp
 Chương 1How to do fundamental analysis on crypto.Fundamental analysis on crypto studies what could give a coin lasting demand. Most coins have no earnings, so you look at what the network does, who pays to use it, how its supply will grow, whether the token captures any fees and who controls the project. It helps you judge value and dilution, and it is weak at timing.
 Chương 1Technical analysis and price action in crypto.Technical analysis on crypto uses the same tools as on any chart: trend, support and resistance, candles and indicators. Crypto adds quirks. The market never closes, so the daily candle depends on your platform's settings. Each exchange prints its own price, forced selling leaves long wicks, and moves that span years read better on a log scale.

