The ABCD pattern.
The ABCD pattern is a four-point price shape with two moves in the same direction, AB and CD, split by a pullback, BC. In the classic form, BC retraces 61.8% to 78.6% of AB, and CD matches AB in length. Point D marks a zone where some traders expect a reversal, though the evidence for it is weak.
Nội dung này hiện chỉ có bản tiếng Anh.

Picture EUR/USD falling 100 pips, bouncing part of the way back, then falling another 100 pips. Those three moves, drawn between four turning points, form an ABCD pattern.
The last point, D, is where some traders expect the fall to pause or turn.
The ABCD pattern is the simplest harmonic pattern, a family of chart shapes defined by Fibonacci ratios between price swings. The later lessons in this module, starting with the three-drives pattern, build on it.
What does an ABCD pattern look like?
An ABCD has four swing points joined by three legs. AB is the first move, BC is a pullback against it, and CD is a second move in the same direction as AB.
In a bullish ABCD, price falls from A to B, rises to C, then falls to D below B. It is called bullish because D is where some traders look to buy.
A bearish ABCD is the mirror image. Price rises from A to B, dips to C, then rises to D above B, where some traders look to sell.
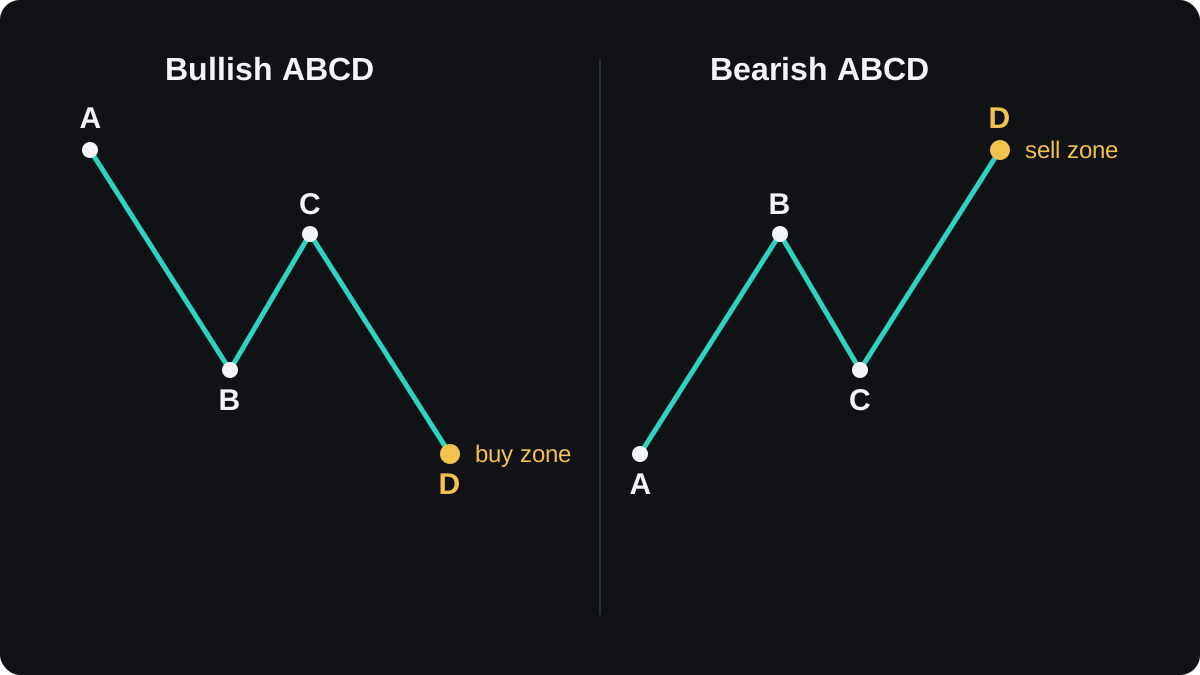
The two drives, AB and CD, usually look alike. In the cleanest examples they cover a similar distance and take a similar number of candles. Matching price distance is the main rule, and matching time is a looser check.
Which ratios define the ABCD pattern?
Two measurements decide whether a shape counts. The first is how far BC pulls back, measured as a Fibonacci retracement of AB. The second is how far CD travels.
In the classic version, BC retraces between 61.8% and 78.6% of AB. Some traders accept a wider range, from 38.2% to 88.6%. C must stay short of A, or the structure is something else.
CD then matches AB in length, a version often written AB=CD. Measured against BC instead, CD is a Fibonacci extension of about 127.2% to 161.8% of BC.
Those two ranges are tied together by simple arithmetic. If CD equals AB exactly, then CD divided by BC equals AB divided by BC, which is one divided by the retracement ratio.
| BC retraces AB | CD as a share of BC (when CD = AB) |
|---|---|
| 38.2% | 261.8% |
| 50.0% | 200.0% |
| 61.8% | 161.8% |
| 78.6% | 127.2% |
| 88.6% | 112.9% |
A deeper pullback means a shorter CD relative to BC, because CD still has to equal AB. So a 61.8% pullback pairs with a 161.8% extension, and a 78.6% pullback pairs with about 127.2%.
There is also an extended version in which CD is 127.2% or 161.8% of AB. That puts D further away and widens the range of places where the pattern can finish.
Worked example: finding point D on EUR/USD
These prices are round and illustrative. On EUR/USD one pip is 0.0001.
- A is a swing high at 1.10000. Price falls to a swing low, B, at 1.09000. AB is 1.10000 − 1.09000 = 0.01000, or 100 pips.
- Price bounces to C at 1.09618. BC is 1.09618 − 1.09000 = 0.00618, or 61.8 pips.
- Check the pullback: 61.8 ÷ 100 = 0.618, a 61.8% retracement, inside the classic range.
- Project AB=CD from C: 1.09618 − 0.01000 = 1.08618. That is the projected D.
- Cross-check with BC: 61.8 pips × 1.618 = 100.0 pips, so the 161.8% extension of BC lands on the same price.
- The 127.2% extension of BC is 61.8 × 1.272 = 78.6 pips, which puts it at 1.09618 − 0.00786 = 1.08832.
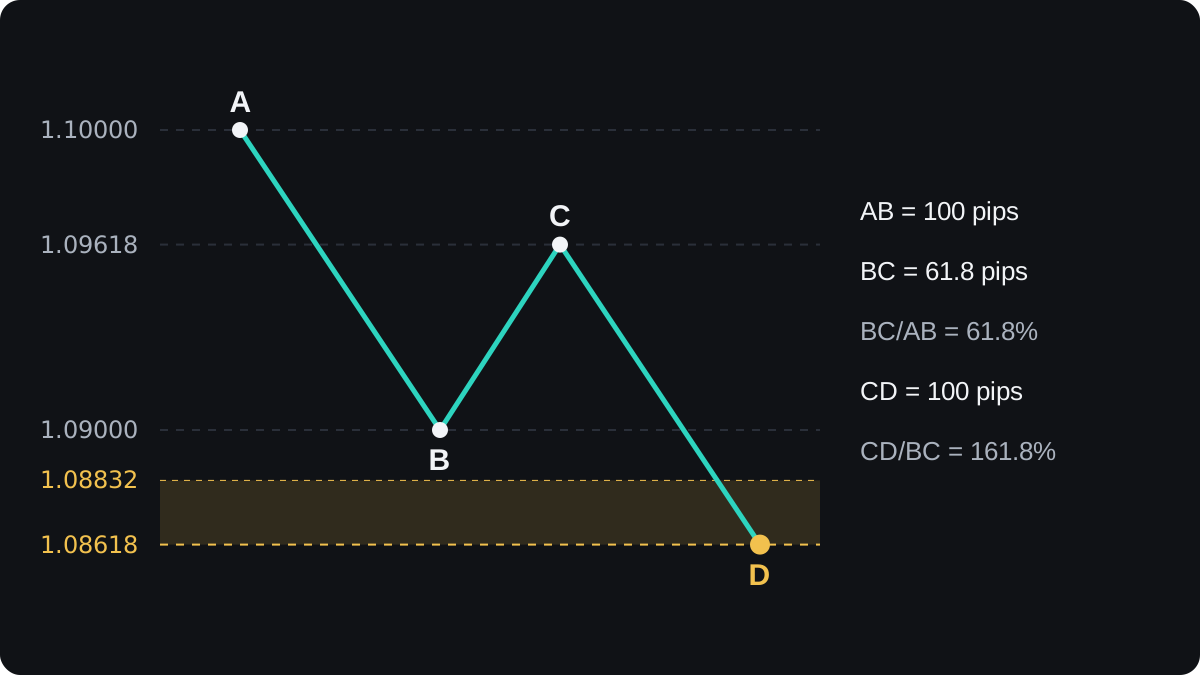
When two separate measures point to one price, the overlap is called a confluence. Here AB=CD and the 161.8% extension agree by construction, because C sits exactly at 61.8%. Real charts rarely line up this neatly.
The band from 1.08832 down to 1.08618 is where this pattern would finish. The Fibonacci calculator gives the same levels for any swing you enter.
How do traders plan a trade at point D?
One approach is to wait for price to reach D and then look for signs that the fall has stopped before buying. Another is a buy limit order at D, which accepts that price may slice straight through.
The plan below continues the EUR/USD numbers. It illustrates the arithmetic only and is no recommendation to trade.
- Entry at D, 1.08618.
- Stop loss 20 pips below, at 1.08418. The 20 pips is a buffer chosen for this example.
- First target: a 38.2% retracement of CD. CD is 100 pips, so 38.2 pips above D gives 1.08618 + 0.00382 = 1.09000, the same price as B.
- Second target: a 61.8% retracement of CD, 1.08618 + 0.00618 = 1.09236.
The first target offers 38.2 pips of reward for 20 pips of risk, a risk-reward ratio of 38.2 ÷ 20 = 1.91. The second offers 61.8 ÷ 20 = 3.09.
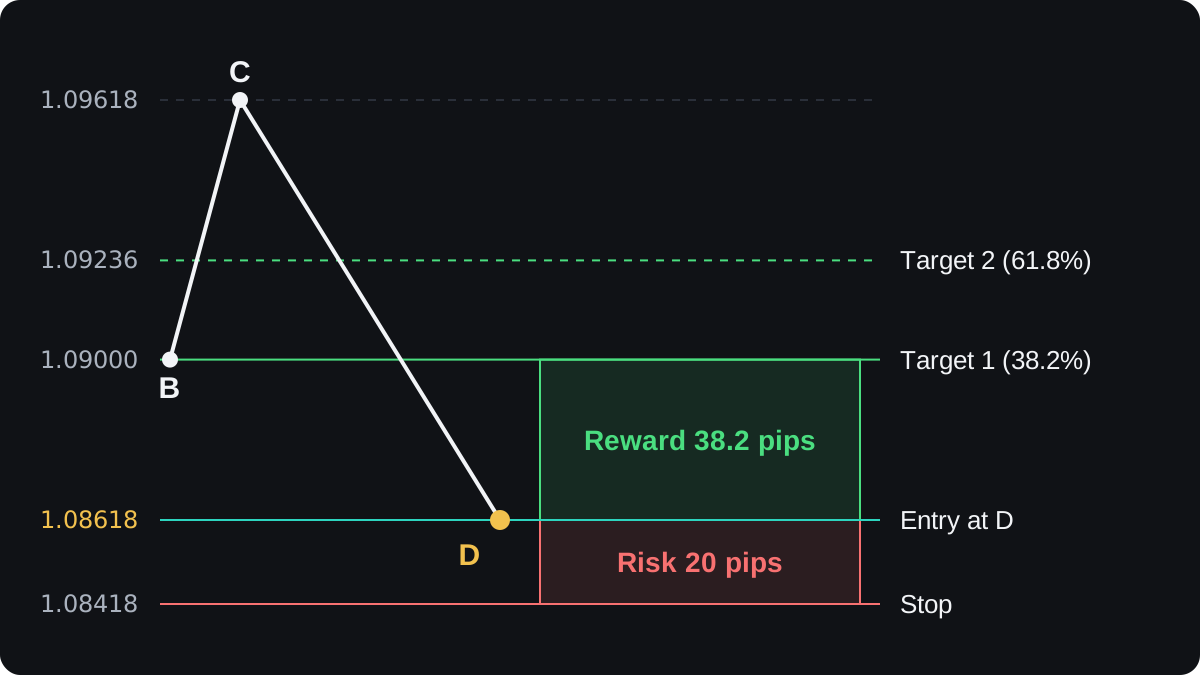
The stop sets the position size. Say the account holds $5,000 and you risk 1%, which is $50. Spread over 20 pips, that is $50 ÷ 20 = $2.50 per pip.
On EUR/USD one standard lot is worth $10 per pip, so $2.50 per pip is 0.25 lot. At the first target the gain is 38.2 × $2.50 = $95.50. At the stop the loss is 20 × $2.50 = $50.
Charts usually plot the bid, and a buy fills at the higher ask. Your real entry and result shift by the spread.
Where does the ABCD pattern fail?
The ratios describe a shape. They give price no reason to stop at D, and in a strong trend price can run straight through D, turning the expected reversal into one more step of the move.
Choosing the points is subjective. One chart can hold several candidate A and B swings on different timeframes, and each gives a different D. Perfect patterns are easy to find afterwards and much harder to spot while they form.
Evidence that the pattern predicts anything is thin. Independent, published tests showing that harmonic patterns beat chance after costs are scarce, and no accepted theory explains why Fibonacci ratios should govern prices.
One proposed explanation is attention: if enough orders sit near a watched level, price may react there. That is hard to test, and it offers no protection when news moves the market.
You can treat the ABCD as a map of where to pay attention and let the stop do the protecting. A backtest that counts every pattern, including the failures, shows how it behaved on the pairs and timeframes you trade.
Câu hỏi thường gặp
Is the ABCD pattern reliable?
No chart pattern is reliable on its own. There is little independent evidence that the ABCD beats chance after costs, so treat point D as a zone to watch and always use a stop.
What is the difference between ABCD and AB=CD?
In everyday use they mean the same pattern. AB=CD stresses the rule that the CD leg matches the AB leg in length, while ABCD simply names the four points.
What happens if C goes beyond A?
In a bullish setup, C above A means BC has retraced more than 100% of AB. The swings then form a different structure, and the D projection no longer applies.
Which timeframe is best for the ABCD pattern?
The ratios are the same on every timeframe. Patterns on short charts form often but are easily disturbed by small swings and spreads, while patterns on daily charts form rarely and need wider stops.
Do I need special software to find ABCD patterns?
No. A Fibonacci tool on any charting platform measures the legs. Scanners that draw patterns automatically still depend on which swings they pick as A and B.
Học tiếp
 Chương 3The three-drives pattern.The three-drives pattern is three pushes in the same direction, each separated by a pullback, with the drives and pullbacks close in size. After a rise it shows three higher highs and hints at a turn down; after a fall, three lower lows hint at a turn up. It signals possible exhaustion, never a guaranteed reversal.
 Chương 3The Gartley pattern.The Gartley pattern is a five-point price shape, X, A, B, C and D, measured with Fibonacci ratios. B retraces 61.8% of the first leg, XA, and the pattern completes at D, near a 78.6% retracement of XA. Traders watch D for a possible reversal, but the rules vary and evidence for the pattern is weak.
 Chương 3Crab and butterfly patterns.Crab and butterfly patterns are harmonic patterns whose final point, D, lands beyond the starting point X. In a butterfly, D sits at about 1.27 times the XA leg from A. In a crab it sits at about 1.618. Traders watch D as a possible turning zone, but the ratios are conventions with limited evidence.

