The Gartley pattern.
The Gartley pattern is a five-point price shape, X, A, B, C and D, measured with Fibonacci ratios. B retraces 61.8% of the first leg, XA, and the pattern completes at D, near a 78.6% retracement of XA. Traders watch D for a possible reversal, but the rules vary and evidence for the pattern is weak.
Nội dung này hiện chỉ có bản tiếng Anh.

The Gartley pattern is a zigzag of four price swings that ends at a level where pattern traders watch for a turn. It is measured with Fibonacci ratios, and its signature is a pullback of 61.8% of the first swing.
It extends the ABCD pattern from earlier in this module by adding one more point at the start. That extra point, X, is what the rest of the pattern is measured against.
What does a Gartley pattern look like?
A Gartley has five turning points, labelled X, A, B, C and D. The four swings between them are called legs: XA, AB, BC and CD.
In a bullish Gartley, price rises from X to A, falls to B, rises to C and falls again to D. The shape looks like a letter M, and the expected move from D is up.
A bearish Gartley is the mirror image. Price falls from X to A, rises to B, falls to C and rises to D, a W shape, and the expected move from D is down.
Two rules hold the shape together. B and D stay inside the XA leg, so D never goes past X. C stays inside the AB leg, so it never goes past A.
Which Fibonacci ratios define a Gartley?
Each leg is measured as a fraction of an earlier leg, using Fibonacci retracement ratios. This is one widely used set for the bullish version, with the numbers from the worked example in the next section:
| Point or leg | Common rule | In the worked example |
|---|---|---|
| B | AB retraces 61.8% of XA | 61.8 pips, B at 1.10382 |
| C | BC retraces 38.2% to 88.6% of AB | 50%, 30.9 pips |
| D | 78.6% retracement of XA | 78.6 pips, D at 1.10214 |
| CD leg | 127.2% to 161.8% of BC | 154%, 47.7 pips |
The 78.6% level is the square root of 0.618, rounded. It is where the pattern is said to complete, and the area around it is often called the potential reversal zone.
Treat the table as one version. The name comes from H. M. Gartley, who described a similar shape in a 1935 book on stock trading.
The exact ratios were added decades later by other writers, and their rule sets differ in the details.
Real prices rarely land exactly on a ratio. Every trader allows some tolerance, and there is no standard for how much, which is one reason two people can read the same chart differently.
Measuring a Gartley step by step
Here is a bullish Gartley on EUR/USD with round illustrative prices, the kind of swing you might see on a one-hour chart. A pip on this pair is 0.0001.
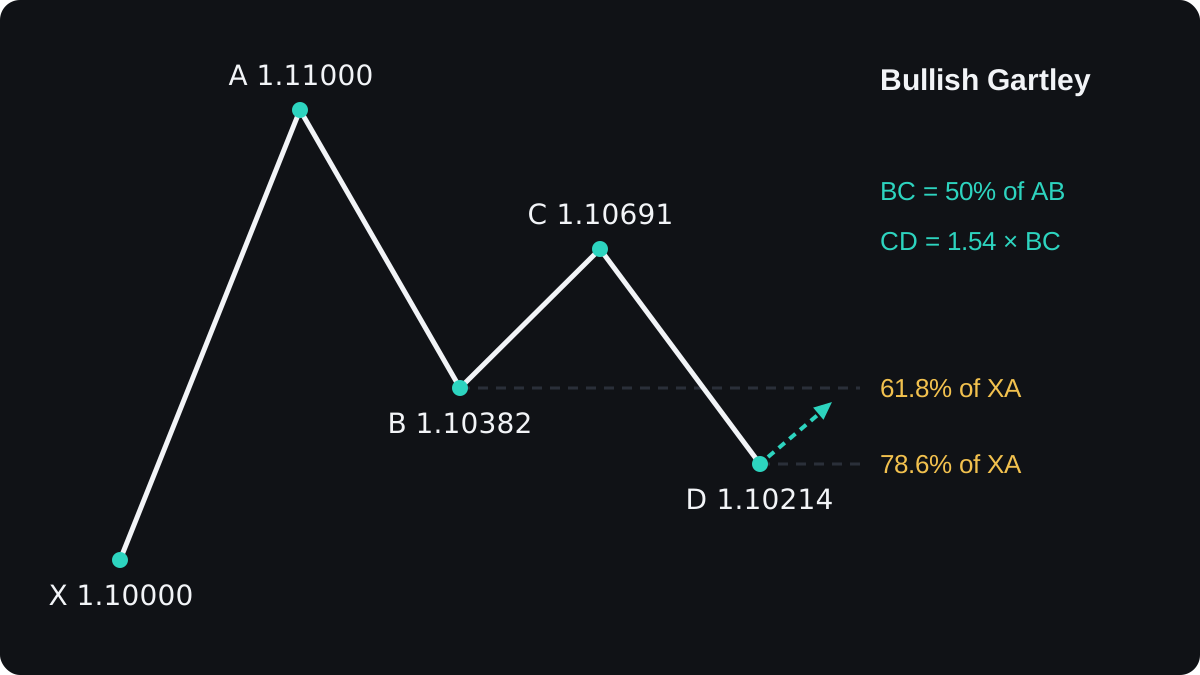
- X is a low at 1.10000 and A is a high at 1.11000. The XA leg is 0.01000, or 100 pips.
- B should sit 61.8% of XA below A: 0.618 × 100 = 61.8 pips. So B = 1.11000 − 0.00618 = 1.10382.
- Price bounces 50% of the 61.8 pip AB leg: 0.5 × 61.8 = 30.9 pips. So C = 1.10382 + 0.00309 = 1.10691, inside the 38.2% to 88.6% range.
- D should sit 78.6% of XA below A: 0.786 × 100 = 78.6 pips. So D = 1.11000 − 0.00786 = 1.10214.
- Check the last leg. CD = 1.10691 − 1.10214 = 0.00477, or 47.7 pips. Then 47.7 ÷ 30.9 = 1.54, inside the 1.272 to 1.618 range.
All four ratios fit, so the shape qualifies under this rule set. D at 1.10214 is still 21.4 pips above X, so the pattern has not broken its own limit.
D is found from two directions. The CD leg should be 1.272 to 1.618 times BC, which is 1.272 × 30.9 = 39.3 pips to 1.618 × 30.9 = 50.0 pips below C. That gives a band from 1.10298 down to 1.10191.
The 78.6% level of XA, 1.10214, falls inside that band. Pattern traders look for this overlap, and when the two measurements land far apart, the zone is wide and harder to use.
A Fibonacci calculator does these sums once you enter the swing high and low.
How do traders plan a trade at point D?
A completed pattern gives you a price to watch, with no promise that price turns there.
One common plan is to wait for price to reach D, then look for a sign that selling is fading, such as a reversal candle at the level, before buying.
The stop usually goes beyond X, because a move past X breaks the pattern's own rule. Targets are often set as retracements of the AD leg, the fall from A to D.
The example continues with a $5,000 account risking 1% per trade, figures chosen only for the arithmetic.
- Entry at D is 1.10214. The stop goes 10 pips below X, at 1.09900. Risk = 1.10214 − 1.09900 = 0.00314, or 31.4 pips.
- The AD leg is 1.11000 − 1.10214 = 0.00786, or 78.6 pips.
- Target 1 is 38.2% of AD: 0.382 × 78.6 = 30.0 pips, so 1.10514.
- Target 2 is 61.8% of AD: 0.618 × 78.6 = 48.6 pips, so 1.10700.
- Size: 1% of $5,000 is $50. One standard lot of EUR/USD is $10 a pip, so 31.4 pips cost $314 per lot. $50 ÷ $314 = 0.159 lot, rounded down to 0.15 lot.
- At 0.15 lot a pip is worth $1.50. The stop loses 31.4 × $1.50 = $47.10. Target 1 makes 30.0 × $1.50 = $45.00, and target 2 makes 48.6 × $1.50 = $72.90.
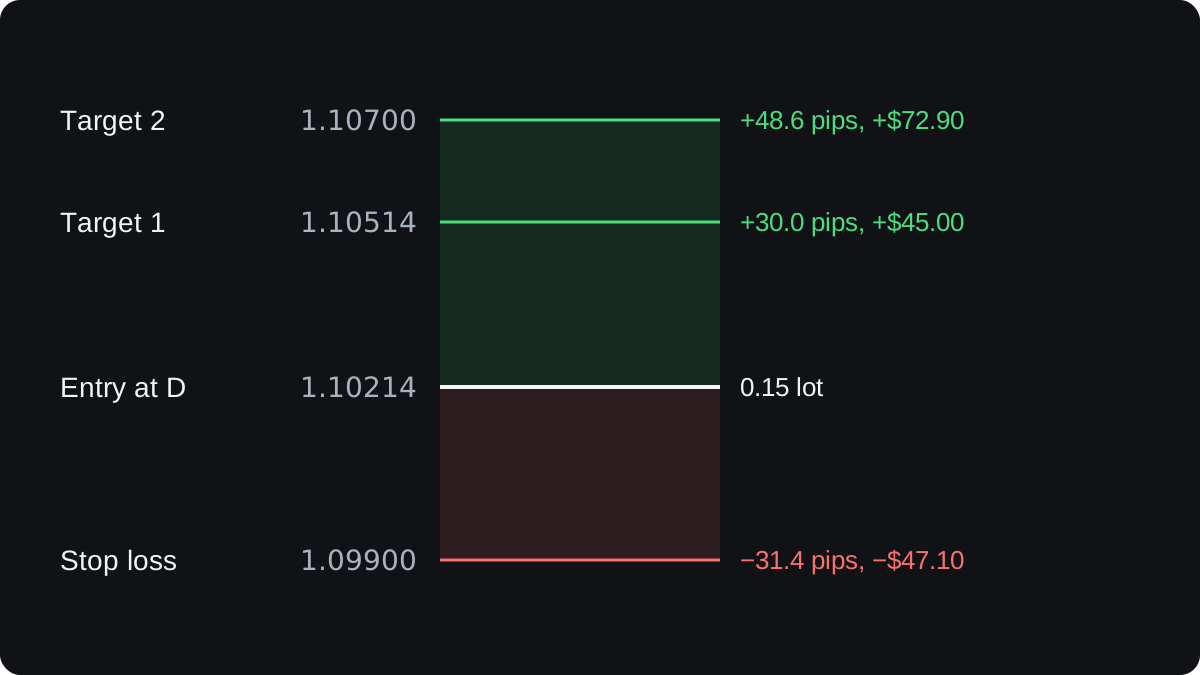
In this example the first target pays slightly less than the stop costs. A trader who always exits there needs to win about 51% of trades to break even before costs, since 47.10 ÷ (47.10 + 45.00) = 0.511.
The risk-reward lesson covers that trade-off, and the position size lesson shows the sizing step for other pairs.
Where does the Gartley pattern fail?
If price keeps falling through X, the shape is no longer a Gartley. The stop at 1.09900 sits just past that line for this reason.
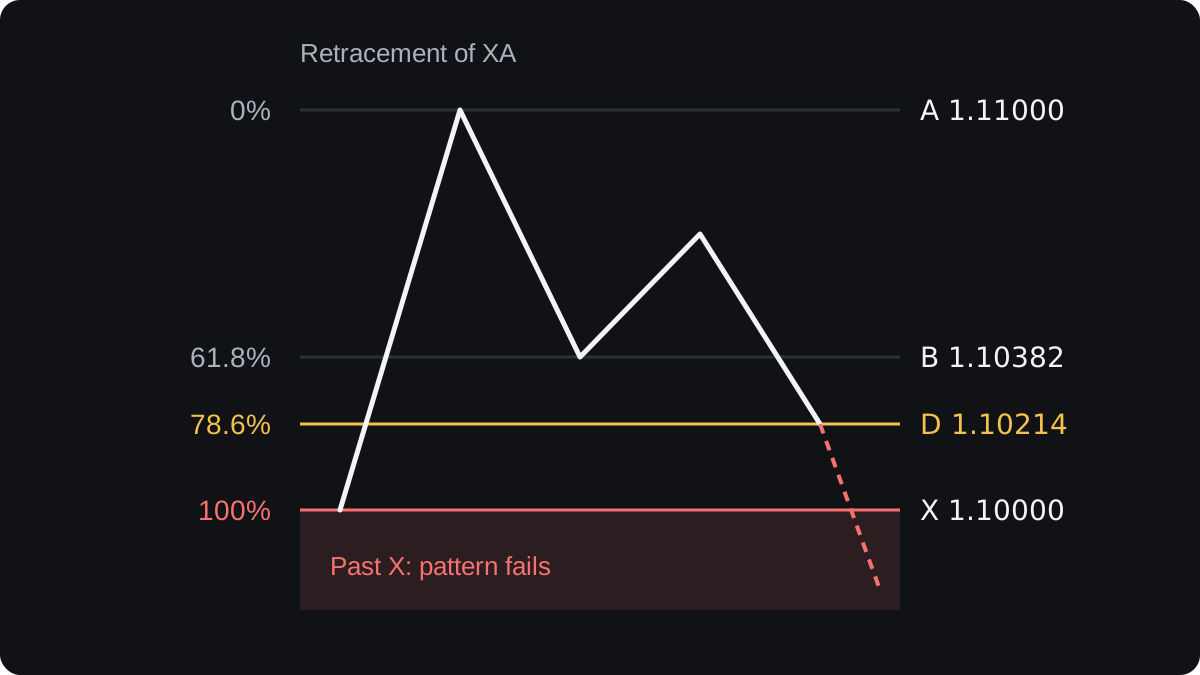
Some harmonic patterns do allow D beyond X. Those are the crab and butterfly patterns, covered in the next lesson, and they use different ratios.
A clean Gartley can also fail without reaching X. Price may bounce a few pips from D and roll over before target 1, leaving a trade that is neither stopped out nor paid.
Drawing is subjective too. You choose which swing highs and lows count as X, A, B and C.
On a past chart it is easy to pick the swings that fit, and that habit makes the pattern look more reliable than it is.
Evidence for the pattern is thin. Independent, peer-reviewed tests of harmonic patterns are scarce, and much of what is published comes from people who sell courses or software.
Treat the 61.8% and 78.6% levels as places to pay attention, without assuming price will turn there. If you want to use the pattern, write down your tolerances before testing them on past charts, and then try them on a demo account.
Câu hỏi thường gặp
Is the Gartley pattern reliable?
No chart pattern is reliable on its own. The rules differ between authors and independent evidence is weak, so test any Gartley rule on past data and a demo before risking money.
What is the difference between a Gartley and a butterfly pattern?
In a Gartley, D stays inside the XA leg, at about 78.6% of it. In a butterfly, D goes beyond X, so the stop and targets sit in different places.
Why is 78.6% used in the Gartley?
It is the square root of 0.618, rounded to one decimal. Harmonic traders treat it as a Fibonacci-related level, although it is not a ratio taken directly from the Fibonacci sequence.
Can you trade a Gartley on any timeframe?
The ratios are the same on any chart. Short timeframes produce more patterns with smaller legs, so the spread takes a larger share of each trade.
Học tiếp
 Chương 3The ABCD pattern.The ABCD pattern is a four-point price shape with two moves in the same direction, AB and CD, split by a pullback, BC. In the classic form, BC retraces 61.8% to 78.6% of AB, and CD matches AB in length. Point D marks a zone where some traders expect a reversal, though the evidence for it is weak.
 Chương 3The three-drives pattern.The three-drives pattern is three pushes in the same direction, each separated by a pullback, with the drives and pullbacks close in size. After a rise it shows three higher highs and hints at a turn down; after a fall, three lower lows hint at a turn up. It signals possible exhaustion, never a guaranteed reversal.
 Chương 3Crab and butterfly patterns.Crab and butterfly patterns are harmonic patterns whose final point, D, lands beyond the starting point X. In a butterfly, D sits at about 1.27 times the XA leg from A. In a crab it sits at about 1.618. Traders watch D as a possible turning zone, but the ratios are conventions with limited evidence.

