Crab and butterfly patterns.
Crab and butterfly patterns are harmonic patterns whose final point, D, lands beyond the starting point X. In a butterfly, D sits at about 1.27 times the XA leg from A. In a crab it sits at about 1.618. Traders watch D as a possible turning zone, but the ratios are conventions with limited evidence.
Nội dung này hiện chỉ có bản tiếng Anh.

In the Gartley pattern, the last leg stops before it reaches the point where the whole move started. The butterfly and the crab carry on past it. Their final point, D, lands beyond the starting point X.
Traders who use these patterns treat D as a level where an already stretched move may turn, and they plan a trade around that price.
How do extended patterns differ from the Gartley?
All three patterns share the same five points, X, A, B, C and D, joined by four legs. Each leg is compared with an earlier one using the ratios behind Fibonacci retracements.
The difference is where D sits on the first leg, XA. A Gartley's D retraces about 0.786 of XA, so it stays inside the leg. Butterfly and crab D points go further.
A butterfly's D reaches about 1.27 of XA and a crab's about 1.618, both measured from A. An extended harmonic pattern is one whose D lies beyond X, so its D level is an extension of XA.
| Pattern | B retraces XA | D measured on XA | Where D sits |
|---|---|---|---|
| Gartley | 0.618 | 0.786 | Inside XA, short of X |
| Butterfly | 0.786 | 1.27 | Beyond X |
| Crab | 0.382 to 0.618 | 1.618 | Far beyond X |
In all three, C retraces 0.382 to 0.886 of AB. Authors publish slightly different ratio sets, so read these as common values. No official body defines them.
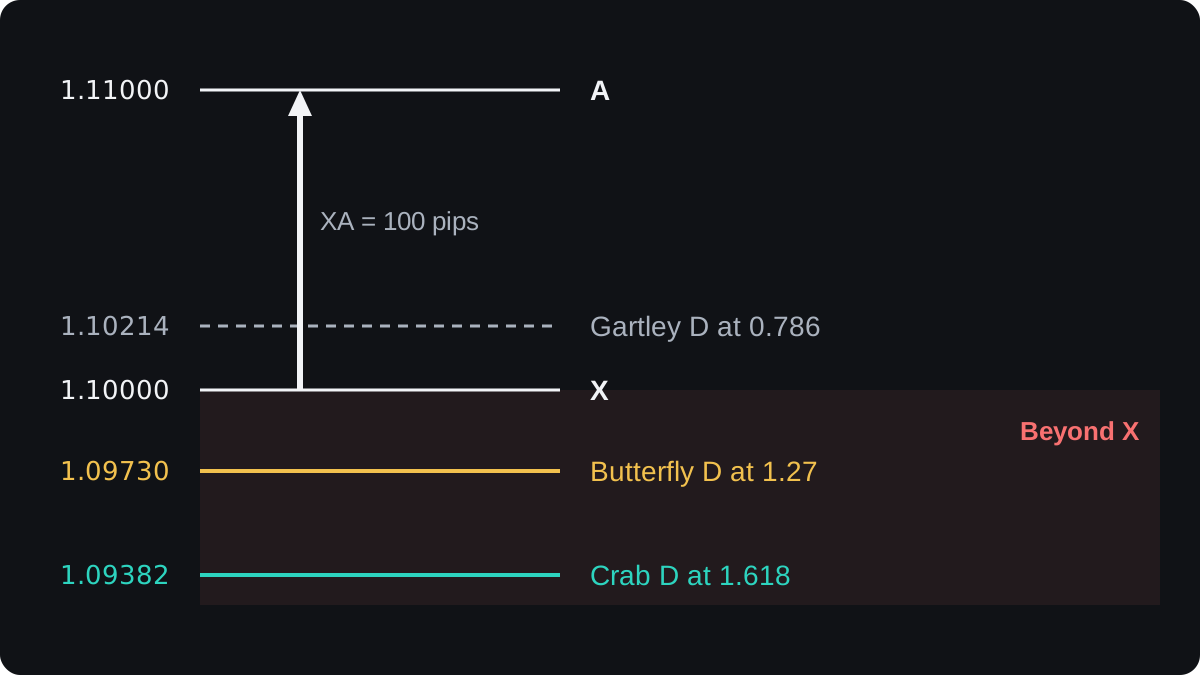
Take a rise on EUR/USD from X at 1.10000 to A at 1.11000, a leg of 100 pips. These prices are illustrative.
On that leg, a Gartley D would sit at 1.10214, a butterfly D at 1.09730 and a crab D at 1.09382.
How do you spot a butterfly?
A bullish butterfly starts with a rise from X to A. Price then falls to B, rallies to C, and drops through X to finish at D. A bearish butterfly is the mirror image, ending above X, where a fall might follow.
The usual butterfly ratios are:
- B retraces 0.786 of XA.
- C retraces 0.382 to 0.886 of AB.
- CD is 1.618 to 2.24 times BC, a measure called the BC projection.
- D lands at 1.27 of XA, and some versions accept up to 1.618.
Here is a bullish butterfly built on the same leg, with B at 1.10214 and C at 1.10700:
- XA is 1.11000 minus 1.10000 = 0.01000, which is 100 pips.
- B is 1.11000 minus 0.786 × 0.01000 = 1.10214, a drop of 78.6 pips from A.
- C at 1.10700 is 48.6 pips above B, and 48.6 ÷ 78.6 = 0.618 of AB.
- D is 1.11000 minus 1.27 × 0.01000 = 1.09730, which is 27 pips below X.
- CD is 1.10700 minus 1.09730 = 97 pips, and 97 ÷ 48.6 = about 2.0 times BC, inside the 1.618 to 2.24 range.
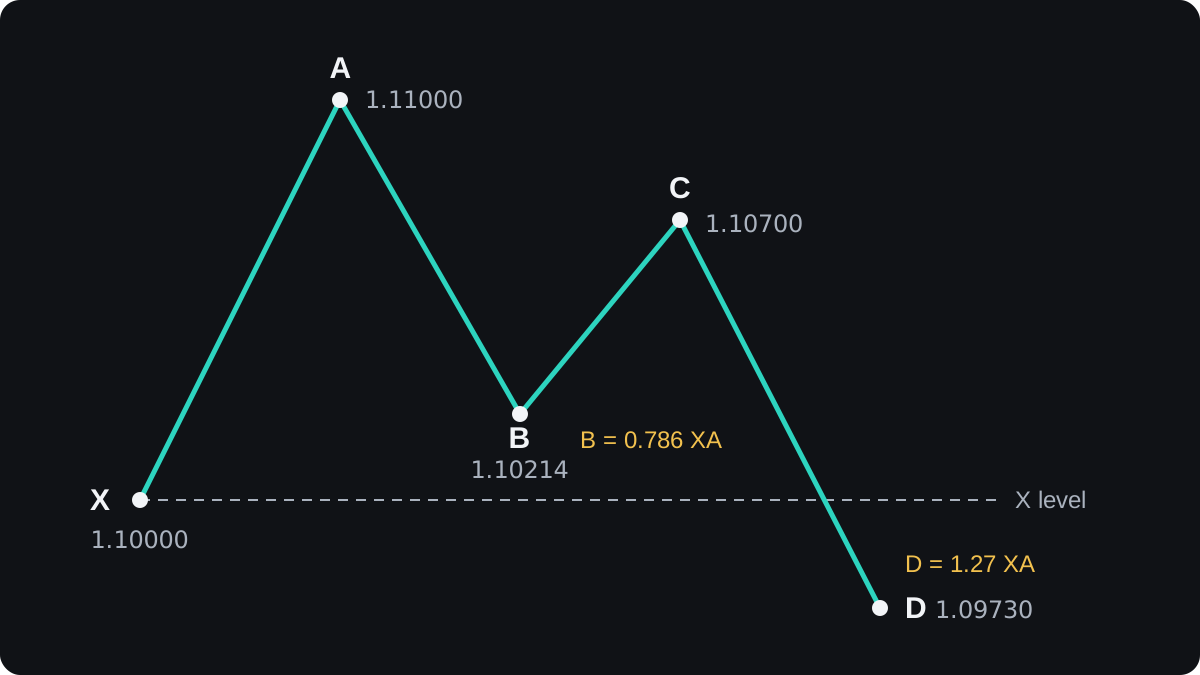
The potential reversal zone is the price area where several of these measurements meet. Here the BC projection of 1.618 to 2.24 runs from 1.09914 down to 1.09611, and the 1.27 XA level at 1.09730 falls inside it.
A tight zone is easier to plan around than a wide one. If the measurements point to prices far apart, the pattern gives you no clear level.
What makes a crab different?
A crab pulls back less at B and reaches much further at D. B retraces only 0.382 to 0.618 of XA, D extends to 1.618 of XA, and the BC projection is usually 2.618 to 3.618.
With the same X and A:
- B at 0.618 of XA is 1.11000 minus 0.00618 = 1.10382, so AB is 61.8 pips.
- C retraces 0.786 of AB: 0.786 × 61.8 = 48.6 pips, so C is 1.10868.
- D is 1.11000 minus 1.618 × 0.01000 = 1.09382, which is 61.8 pips below X.
- CD is 1.10868 minus 1.09382 = 148.6 pips, and 148.6 ÷ 48.6 = 3.06 times BC.
The butterfly's D was 27 pips past X, while the crab's is 61.8 pips past it. A version called the deep crab keeps D at 1.618 but puts B deeper, at about 0.886 of XA.
The move into a crab's D often looks like a strong breakout to new lows. If price does turn there, the swing back can be large. If it does not, a buy at D sits in front of a trend that is still running.
How could a trade on a butterfly be planned?
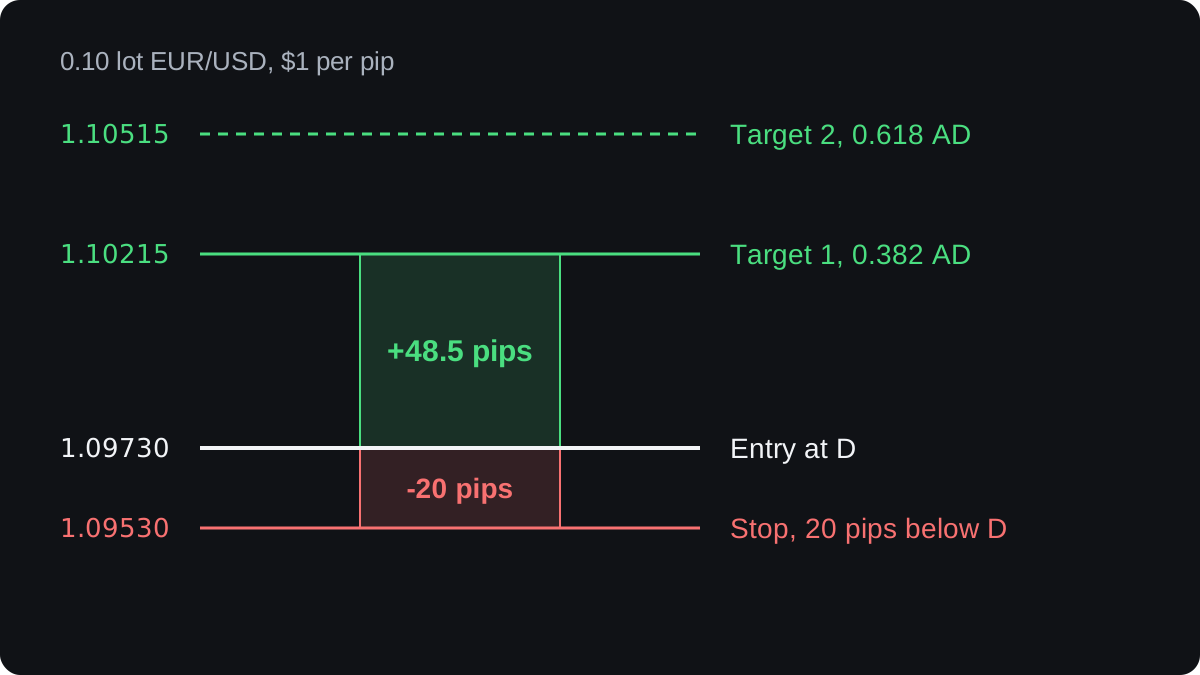
One common way to set targets is to measure the AD leg and take 0.382 and 0.618 of it back up from D. In this example the stop goes a fixed distance past D.
Using the butterfly above, with a buy of 0.10 lot at D:
- AD is 1.11000 minus 1.09730 = 127 pips.
- Target 1 is 0.382 × 127 = 48.5 pips above D, at 1.10215.
- Target 2 is 0.618 × 127 = 78.5 pips above D, at 1.10515.
- The stop is 20 pips below D, at 1.09530. The 20 pips is a choice made for this example.
- On 0.10 lot of EUR/USD, one pip is 10,000 × 0.0001 = $1. The planned loss is $20, Target 1 pays $48.50 and Target 2 pays $78.50.
These sums leave out the spread and any commission, which make each gain smaller and each loss larger. The pip value calculator works out pip values for other pairs and sizes.
You could also wait for a reversal candle at D before buying. You then usually buy above D and the stop is further away, so your position size has to shrink to keep the same dollar risk.
Where do crab and butterfly patterns fail?
The ratios come from practitioners' books and courses. There is little independent, published testing showing that these patterns predict turns better than chance, so treat any claimed hit rate with suspicion.
The ranges are wide. With C allowed anywhere from 0.382 to 0.886 of AB, a great many zigzags on a chart fit some pattern, and spotting a finished pattern after the fact is easy.
Choosing X is a judgement call. Pick a different swing as the start and every level moves, including D.
The pattern also asks you to buy a fall that has already broken below X, or sell a rise that has broken above it. At D, a true breakout and a false breakout look the same.
Strong trends can pass straight through the 1.618 level and keep going. In that case the stop is the only part of the plan that limits the loss.
A written backtest with fixed rules shows how these levels behaved on past data. A momentum check at D, such as divergence, is a common extra filter, and it has false signals of its own.
Câu hỏi thường gặp
What is the difference between a crab and a butterfly pattern?
Both finish with D beyond the starting point X. A butterfly has B at about 0.786 of XA and D near 1.27 of XA, while a crab has a shallower B and D at 1.618, much further past X.
Do harmonic patterns really work?
There is little independent evidence that they predict reversals better than chance. They give you a precise level to plan around, and the outcome depends on your stop, your size and how often price runs straight through D.
Where do you put the stop loss on a crab pattern?
Past D, at a distance you choose before entering, with a position size that turns a full loss into a planned amount. A stop placed right on D can be hit by ordinary price noise.
What happens if price goes straight past D?
The pattern has failed at that level, and the stop closes the trade. Some butterfly versions allow D anywhere from 1.27 to 1.618 of XA, so decide in advance which level counts as the end of the pattern.
Is a bearish crab the same pattern upside down?
Yes. Price falls from X to A, rises to B, dips to C and climbs past X to D with the same ratios, and the trade idea is a possible fall from D.
Học tiếp
 Chương 3The ABCD pattern.The ABCD pattern is a four-point price shape with two moves in the same direction, AB and CD, split by a pullback, BC. In the classic form, BC retraces 61.8% to 78.6% of AB, and CD matches AB in length. Point D marks a zone where some traders expect a reversal, though the evidence for it is weak.
 Chương 3The three-drives pattern.The three-drives pattern is three pushes in the same direction, each separated by a pullback, with the drives and pullbacks close in size. After a rise it shows three higher highs and hints at a turn down; after a fall, three lower lows hint at a turn up. It signals possible exhaustion, never a guaranteed reversal.
 Chương 3The Gartley pattern.The Gartley pattern is a five-point price shape, X, A, B, C and D, measured with Fibonacci ratios. B retraces 61.8% of the first leg, XA, and the pattern completes at D, near a 78.6% retracement of XA. Traders watch D for a possible reversal, but the rules vary and evidence for the pattern is weak.

