How to combine indicators.
Combine indicators by giving each one a different job. Use one tool to read the trend's direction or strength, and another to time entries, such as a moving average with RSI. Avoid stacking tools that measure the same thing, like RSI and Stochastic together, because they repeat one signal and only look like confirmation.
Nội dung này hiện chỉ có bản tiếng Anh.
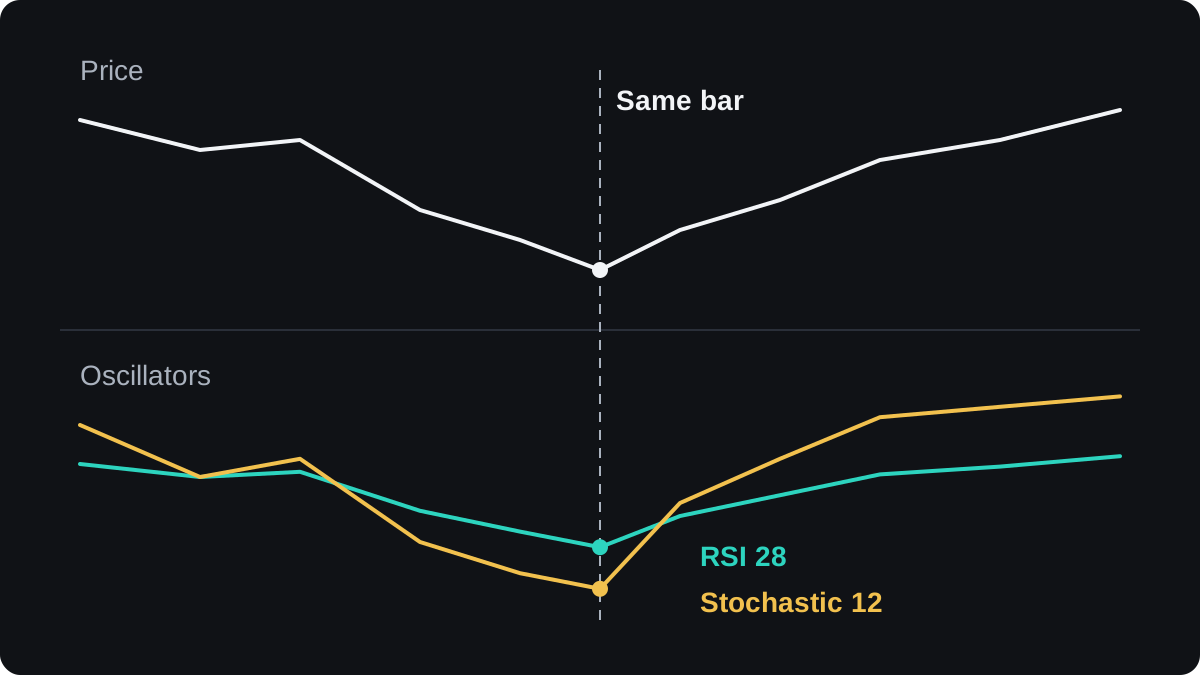
Add RSI to a chart, then the Stochastic oscillator, then MACD. All three may turn upward on the same candle, and it looks like three votes for a trade.
More often it is one vote counted three times, because all three were calculated from the same recent prices.
A better approach gives each indicator a separate job. The most common pairing uses one tool to read the trend and a second tool to time an entry inside that trend.
Why do similar indicators repeat each other?
Each indicator in this module is a formula applied to past prices. RSI compares the average size of recent gains with recent losses. The Stochastic oscillator shows where the latest close sits within the recent high to low range.
Both climb when price climbs and drop when it drops. Their lows and highs tend to land on the same or nearby bars, so seeing the second one agree tells you little the first had not.
The same overlap appears elsewhere. With default settings the MACD line is the 12-period exponential moving average minus the 26-period one, so the MACD line crossing zero is the exact bar where those two averages cross.
Bollinger Bands carry a moving average too. With default settings the middle band is a 20-period simple moving average, so adding a separate 20-period SMA puts the same line on your chart twice.
Sort indicators by the question they answer
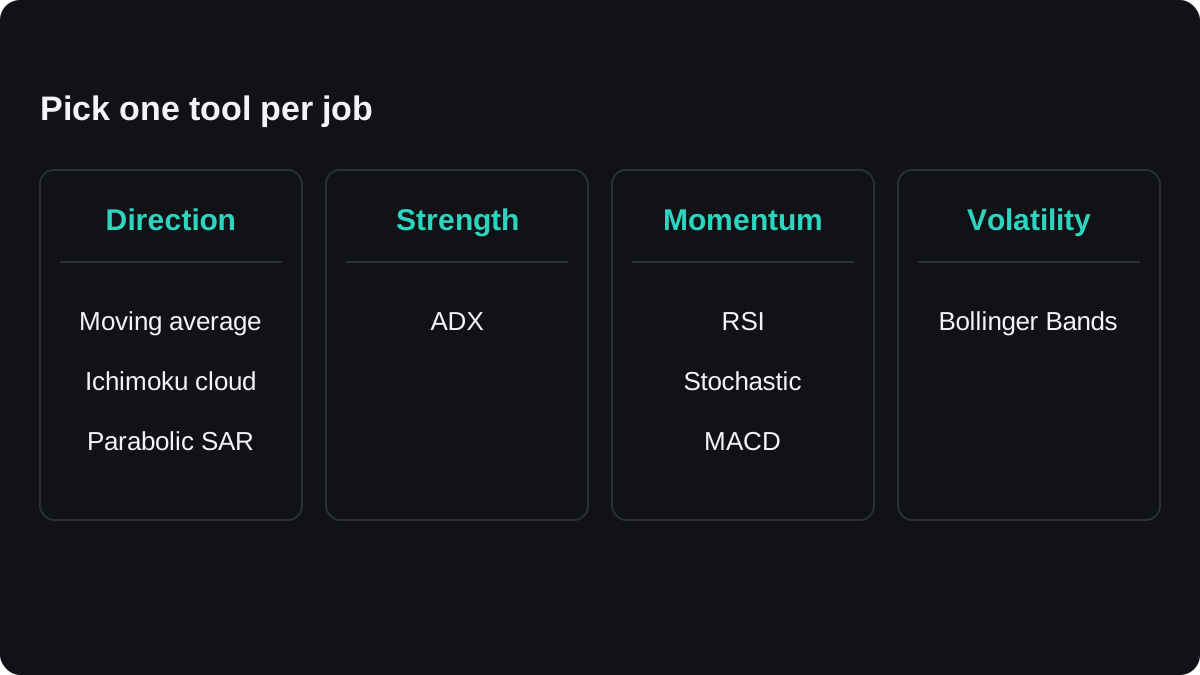
A cleaner way to choose is to ask what each tool tells you that your other tools cannot. Most chart indicators answer one of four questions.
| Question | Family | Examples in this module |
|---|---|---|
| Which way is price trending? | Direction | Moving averages, Ichimoku cloud, Parabolic SAR |
| How strong is the trend? | Strength | ADX |
| Is the move speeding up or stretched? | Momentum | RSI, Stochastic, MACD |
| How wide are the swings? | Volatility | Bollinger Bands |
MACD sits near the border. It is built from moving averages, so it is often read as a direction tool as well. Give it one role in your rules and judge your other choices against that role.
ADX measures trend strength and ignores direction. A rising ADX can mean a strong fall as easily as a strong rise, which is why it is normally paired with a direction tool.
A sound combination takes no more than one tool from each family it needs. Two tools from different families give you two separate readings, while two from the same family mostly give you one.
Why a trend tool and a momentum tool fit together
Each type fails in a way the other can cover. In a strong uptrend, RSI can stay above 70 for a long time while price keeps rising, and selling every overbought reading means trading against the move.
A moving average has the opposite weakness. It confirms a trend late, and knowing that price is above it says nothing about when to enter.
Put together, the trend tool decides which side you trade and the momentum tool picks the moment. In an uptrend you ignore the oscillator's sell signals and use its dips as possible buying points.
Oscillator levels often need adjusting in a trend. RSI may not reach 30 during a pullback in an uptrend, so a rule might treat a drop below 40 as the dip instead.
Worked example: a 50 EMA with RSI
Here is one way to write the pairing as rules. It is an example to study, and it carries no promise of profit.
- Trade only long while price is above a rising 50-period exponential moving average.
- Wait for RSI (14) to fall below 40 during a pullback.
- Buy when RSI closes back above 40.
- Place the stop 10 pips below the pullback low and the target at twice the stop distance.
Now apply it to EUR/USD on a 4-hour chart, with round illustrative prices and a size of 0.10 lot:
- The 50 EMA is rising and sits near 1.09500. Price pulls back to a low of 1.09700 and stays above the average.
- RSI drops to 36, then closes back above 40 as price reaches 1.10000. You buy at 1.10000.
- Stop: 1.09700 minus 0.00100 is 1.09600. The distance is 1.10000 minus 1.09600 = 0.00400, which is 40 pips.
- Target: twice 40 is 80 pips, or 0.00800. 1.10000 plus 0.00800 is 1.10800.
- On 0.10 lot of EUR/USD a pip is worth $1. The stop risks 40 × $1 = $40 and the target would pay 80 × $1 = $80.
On a $4,000 account, that $40 is 1% of the balance. These sums leave out the spread and any commission, which would make both results slightly worse.
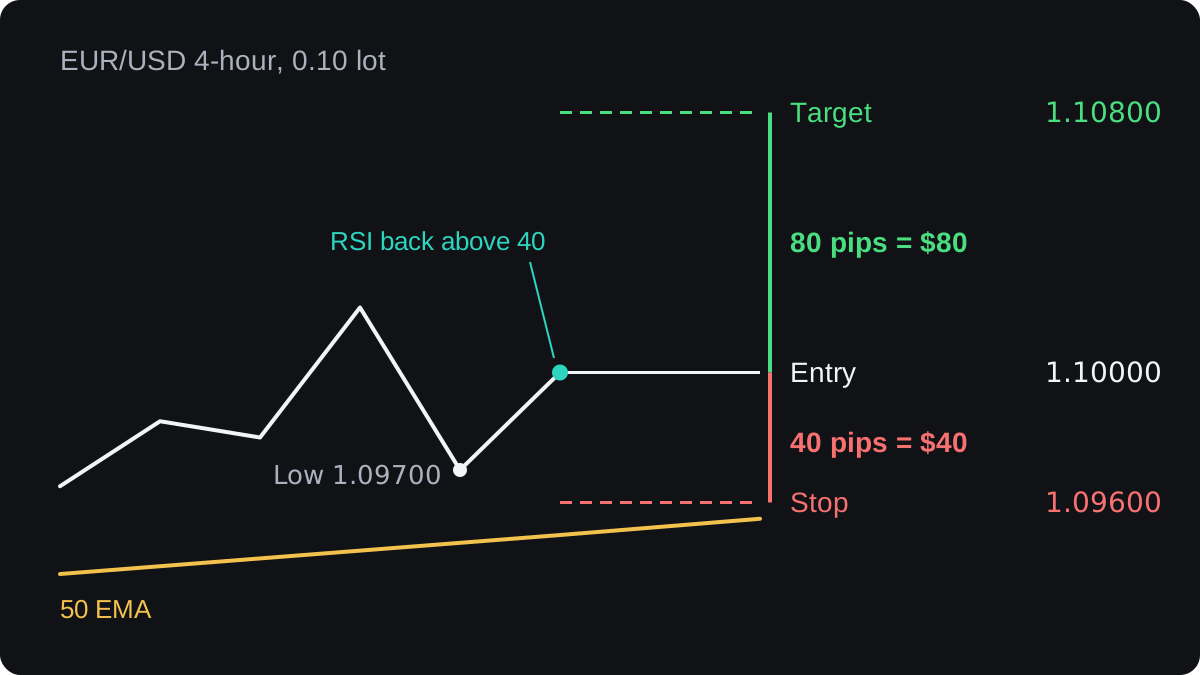
The EMA kept you on the buy side, and RSI chose the entry bar. The 1.10800 target came from the 1:2 risk-reward ratio in rule 4, which neither indicator supplied.
What to do when indicators disagree
Disagreement between tools is useful information. Say price is above a rising EMA but ADX reads 15.
The direction tool sees an uptrend and the strength tool sees almost no trend. A rule can treat that as a reason to wait.
ADX cut-offs are conventions. Readings above 25 are commonly taken as a trend and readings below 20 as a weak one, and you could test other levels.
Avoid breaking a tie by adding a third indicator. If you keep adding tools until one agrees with you, you are looking for permission to take a trade you already wanted.
The cost of adding more indicators
Each extra condition cuts the number of trades. A rule that needs five indicators to line up may rarely fire, and because most indicators smooth past prices, each one adds a little more lag.
Adjusting settings until a combination fits old charts is called curve fitting. The rule then describes past data well and tends to do worse on new data.
Default settings are a sensible place to start. Any change you make should be checked on data you did not use to choose it.
The backtesting lesson shows how to test a rule on past data. A combination changes which trades you take, and only testing can show whether those trades would have paid on your pair and timeframe.
Câu hỏi thường gặp
What is the best indicator combination for forex?
There is no single best one, and no popular pairing has a proven edge on every pair.
A common pairing is a moving average for direction with RSI or the Stochastic for timing, and only testing on your own pair and timeframe can show whether it suits you.
Can you use RSI and Stochastic together?
You can, but they tend to turn on the same or nearby bars, so the second one adds little. Pairing one of them with a direction or volatility tool gives you a separate reading.
How many indicators should you use on one chart?
There is no fixed number. Two or three from different families lets each one do a separate job, while every extra tool cuts the number of trades and adds lag.
Is MACD a trend or a momentum indicator?
It can be read as either. It is built from two moving averages, so it follows the trend, and its histogram shows momentum, so pick one role for it in your rules.
Học tiếp
 Chương 5Bollinger Bands.Bollinger Bands are three lines on a price chart: usually a 20-period simple moving average in the middle, with bands two standard deviations above and below it. The bands widen when price moves a lot and narrow when it is quiet. A narrow stretch, called a squeeze, often comes before a larger move in either direction.
 Chương 5MACD indicator.MACD, short for moving average convergence divergence, measures the gap between a 12-period and a 26-period exponential moving average of price. A 9-period EMA of that gap forms the signal line, and the histogram shows the difference between the two. It is read as momentum, but it lags price and gives many false signals in ranges.
 Chương 5Parabolic SAR.Parabolic SAR is a trend indicator that draws a dot for each bar, below price in an uptrend and above it in a downtrend. The dots move closer to price as the trend extends, and when price crosses them they flip sides. It is often used as a trailing stop, and it gives many false flips in sideways markets.
 Chương 5Stochastic oscillator.The stochastic oscillator shows where the latest close sits within the high to low range of a set number of candles, on a scale of 0 to 100. Readings above 80 are called overbought and below 20 oversold. They describe recent closes near the top or bottom of the range and do not mean price must reverse.
 Chương 5Relative Strength Index (RSI).The Relative Strength Index (RSI) is a momentum indicator that compares the size of recent gains with recent losses and plots the result from 0 to 100. The default uses 14 candles. Readings above 70 are called overbought and below 30 oversold, but in a strong trend RSI can stay beyond those lines for a long time.
 Chương 5Average Directional Index (ADX).The Average Directional Index (ADX) measures how strong a trend is on a scale of 0 to 100, without saying which way it points. Readings above about 25 are commonly read as a trending market and below about 20 as a weak or ranging one. Two companion lines, +DI and −DI, show direction.
 Chương 5Ichimoku Kinko Hyo.Ichimoku Kinko Hyo is a Japanese trend indicator with five lines: a 9-period conversion line, a 26-period base line, two leading spans that form a cloud 26 periods ahead, and the close plotted 26 periods back. Price above the cloud is read as an uptrend bias, below it as a downtrend bias.
 Chương 5Chart indicators cheat sheet.A chart indicator turns past prices into a number or line. Bollinger Bands measure volatility. MACD, Parabolic SAR and Ichimoku follow trend direction. RSI and the stochastic measure momentum, and ADX measures trend strength. Each has a common signal, and each fails in a predictable kind of market, usually trends for oscillators and ranges for trend tools.

