Leading and lagging indicators.
A leading indicator tries to signal a turn before it happens, usually by measuring when a move is slowing, as RSI and the stochastic do. A lagging indicator, such as a moving average, confirms a move after it starts. Leading tools give more false alarms; lagging tools miss the start of each move.
Nội dung này hiện chỉ có bản tiếng Anh.

Picture EUR/USD falling for four days and then turning up. One indicator gives a buy signal two days before the bottom. Another waits until the new rise is two days old.
A lagging indicator follows price and signals after a move has started. A leading indicator tries to signal a turn before it happens, usually by measuring how fast price is moving. Each one pays for its timing in a different way.
Why are some indicators early and others late?
Every indicator is a formula run on past prices. None of them can see the next candle. The labels describe timing: how soon the indicator reacts after price starts to change.
A moving average adds up recent closes and divides by how many there are. When price turns, the old closes are still in the sum, so the average turns later.
That delay is built in, which is why a moving average is the standard lagging tool.
A momentum reading compares today's price with an earlier one. When a fall is slowing, the daily drops get smaller before price stops falling. A tool that measures the slowdown can react before the low, and that is what traders mean by leading.
A fall can also slow, pause and then speed up again. When that happens, the early signal is wrong.
Which indicators are leading and which are lagging?
The table shows the usual labels. They describe typical behaviour, and a tool can act faster or slower depending on its settings.
| Indicator | Usual label | What it reacts to |
|---|---|---|
| Simple and exponential moving averages | Lagging | Average of past closes |
| MACD | Lagging | Gap between two moving averages |
| Parabolic SAR | Lagging | A trailing level that follows the trend |
| ADX | Lagging | Smoothed strength of recent moves |
| RSI | Leading | Size of recent gains against recent losses |
| Stochastic oscillator | Leading | Close compared with the recent high to low range |
| Momentum, rate of change | Leading | Price now against price a set number of bars ago |
Sources do not always agree. MACD is built from moving averages, so it lags, yet some traders watch its histogram as an early warning because it shrinks before the two lines cross.
Most leading tools are oscillators, which move between fixed levels or around a centre line. The next lesson explains what oscillators are and how their levels are set.
A worked example: three signals on one turn
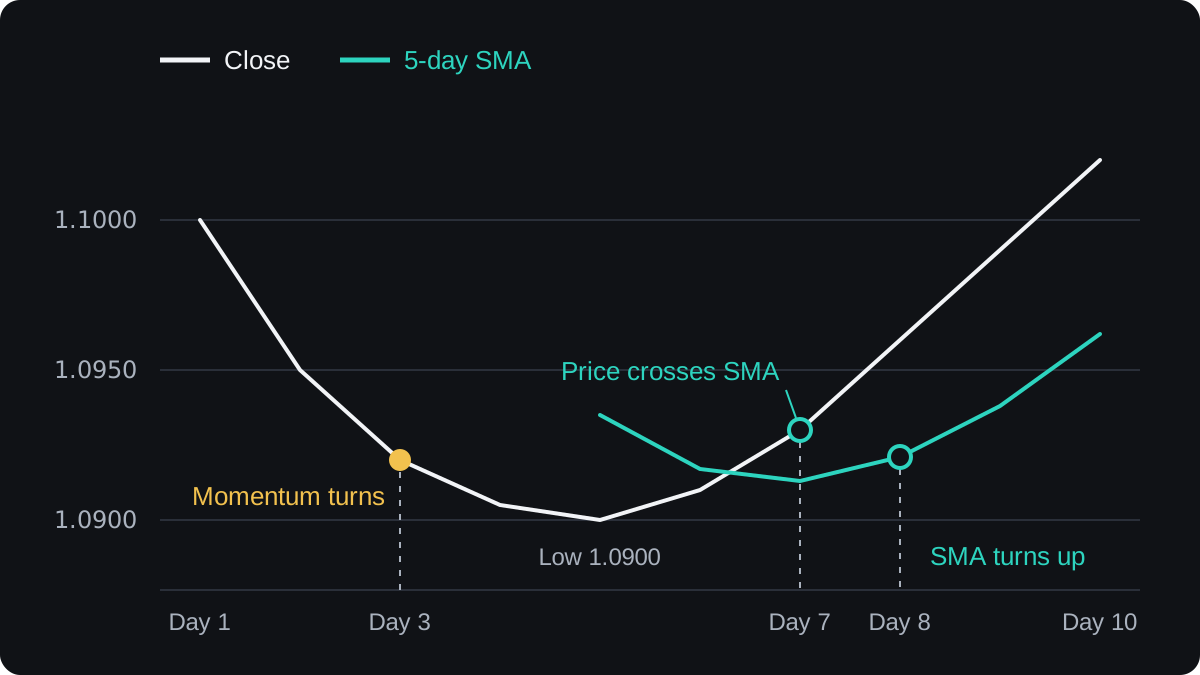
The closes below are illustrative EUR/USD daily prices. They fall for four days, each drop smaller than the last, bottom at 1.0900 on day 5, then rise. The change column is today's close minus yesterday's, in pips.
The last column is a 5-day simple moving average (SMA), the average of the latest five closes. It starts on day 5, the first day with five closes.
| Day | Close | Change (pips) | 5-day SMA |
|---|---|---|---|
| 1 | 1.1000 | ||
| 2 | 1.0950 | −50 | |
| 3 | 1.0920 | −30 | |
| 4 | 1.0905 | −15 | |
| 5 | 1.0900 | −5 | 1.0935 |
| 6 | 1.0910 | +10 | 1.0917 |
| 7 | 1.0930 | +20 | 1.0913 |
| 8 | 1.0960 | +30 | 1.0921 |
| 9 | 1.0990 | +30 | 1.0938 |
| 10 | 1.1020 | +30 | 1.0962 |
To check day 5: 1.1000 + 1.0950 + 1.0920 + 1.0905 + 1.0900 = 5.4675, and 5.4675 ÷ 5 = 1.0935. Each later day drops the oldest close and adds the newest.
Now read three possible buy signals from the table:
- Momentum turns up on day 3. The one-day change rises from −50 pips to −30 pips while the close is 1.0920. Price then falls another 20 pips to the low.
- The close crosses above the SMA on day 7. On day 6 the close of 1.0910 is below the SMA of 1.0917. On day 7 the close of 1.0930 is above the SMA of 1.0913.
- The SMA turns up on day 8. Its lowest value is 1.0913 on day 7, and on day 8 it rises to 1.0921, with the close at 1.0960.
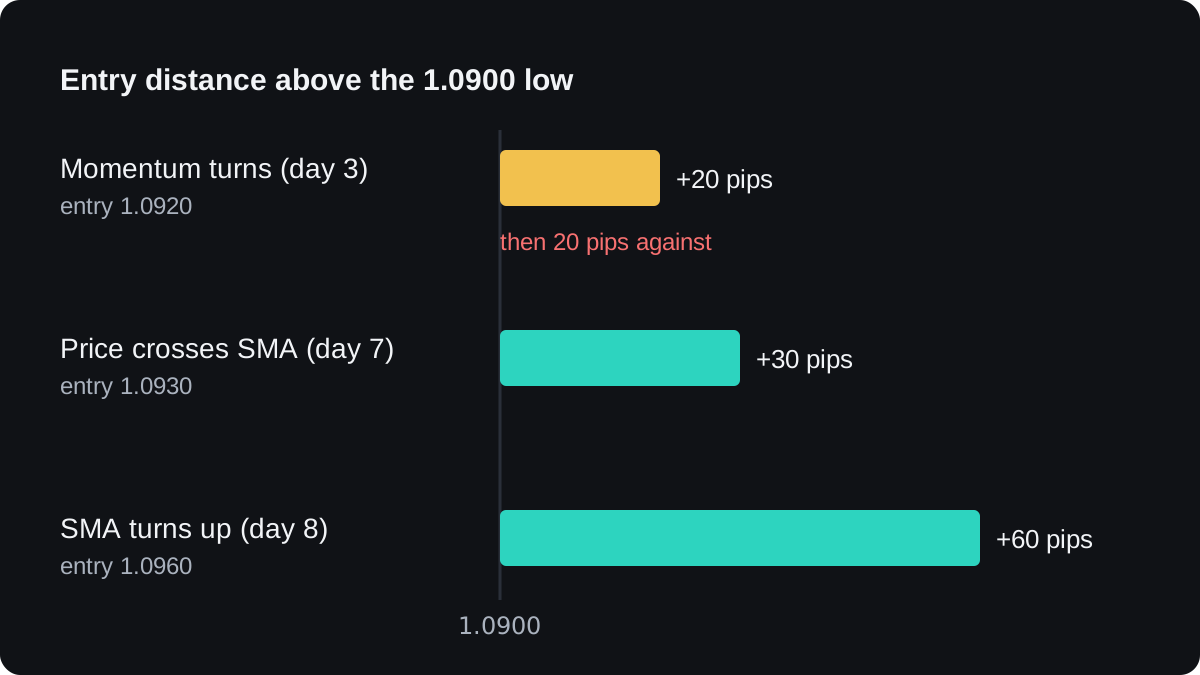
Measure each entry against the low. 1.0920 − 1.0900 = 0.0020, or 20 pips. 1.0930 − 1.0900 = 30 pips. 1.0960 − 1.0900 = 60 pips.
On 0.10 lot of EUR/USD a pip is worth $1. The early buyer sat through a $20 loss before the turn. The two later buyers never saw that loss, but they started $30 and $60 above the low.
Change one number and the early signal looks worse. If day 5 had closed at 1.0850, a drop of 55 pips, the day 3 buyer would be 1.0920 − 1.0850 = 70 pips down.
Both lagging rules would still be waiting in that case. The day 5 SMA would be 5.4625 ÷ 5 = 1.0925, and a close of 1.0850 is far below it.
What does each kind of signal cost?
Leading signals cost you false alarms. An oversold reading on the RSI says price has fallen fast. It does not say the fall is over, and in a strong downtrend the RSI can stay below 30 for many bars.
Lagging signals cost you part of every move. You buy after the low and sell after the high, so you can only catch the middle. When a move is short, the late entry and the late exit can leave little or nothing.
The market condition decides which cost hurts more. In a trending market, a moving average tends to stay on one side of price for a long time, so its lag is a small share of the move.
In a range, price crosses the average back and forth. Each cross is a late signal that soon reverses, a pattern traders call a whipsaw: a signal followed quickly by the opposite signal.
Oscillators tend to suit ranges, where price swings between extremes. They tend to misfire in strong trends, where a reading can stay extreme while price keeps going.
Can you make an indicator faster or more reliable?
The main setting is the period, the number of bars in the calculation. A shorter moving average follows price more closely, and a longer one lags more.
On a steady straight-line move, an n-period SMA sits (n − 1) ÷ 2 bars behind price. That is 2 bars for the 5-day average above and 9.5 bars for a 20-period average.
A faster setting also reacts to more random wiggles, so it gives more signals and more of them are false. A slower leading tool gives fewer false alarms and later warnings, so every setting trades one cost against the other.
Some traders pair the two groups. In one example, a long moving average sets the direction, and a buy counts only when an oscillator turns up from a low reading while price is above that average.
That filter removes some false alarms and keeps some lag. Treat it as an illustration of the trade-off, and test any rule like it before relying on it.
The lesson on how to combine indicators covers the pitfalls, such as two tools that measure the same thing.
No indicator in either group has been shown to give a reliable edge by itself in every market. Before you trust a rule, backtest it and then watch it on a demo account, counting the false signals as well as the good ones.
Câu hỏi thường gặp
Is RSI a leading or lagging indicator?
It is usually called leading, because it can turn before price does when a move slows. It is still built from past closes, so it can stay at an extreme while a trend continues.
Is MACD leading or lagging?
MACD is lagging, because its lines come from moving averages of price. Its histogram can shrink before the lines cross, so some traders read it as an early warning.
Which is better, leading or lagging indicators?
Neither is better in general. Leading tools signal earlier with more false alarms, and lagging tools signal later and miss part of each move, so the market and your rules decide which cost you accept.
Can any indicator predict price?
No. Every indicator is a calculation on past prices, so leading only means it tends to react sooner to a change that has already begun.
Why does my moving average signal come so late?
The average still includes older prices, so it turns after price does. A shorter period reduces the delay but gives more false signals.
Học tiếp
 Chương 1What are oscillators?An oscillator is an indicator that moves back and forth inside a fixed range such as 0 to 100, or around a centre line such as zero. It compares the latest price with recent prices. A high reading means price is near the top of its recent range, and does not mean price must fall.
 Chương 1Using oscillators when the market trends.In a strong trend, an oscillator such as RSI can stay overbought or oversold for a long time, so a reading above 70 is a weak reason to sell on its own. In a trend you flip the reading: wait for the oscillator to dip during a pullback and turn back with the trend, and still use a stop loss.
 Chương 1Momentum indicators and how to read them.A momentum indicator measures how fast price is changing by comparing the latest close with the close a set number of bars ago. When the line is above zero, price is higher than it was. A falling line means the move is slowing. It warns of a weakening trend but does not tell you when, or whether, price will reverse.
 Chương 1Oscillators and momentum cheat sheet.RSI and the stochastic run from 0 to 100 and are read at fixed levels such as 70 and 30. MACD, momentum and CCI have no fixed range and are read around a centre line. All are built from past prices, so an overbought reading can last through a strong trend and is not a sell signal by itself.

