Using oscillators when the market trends.
In a strong trend, an oscillator such as RSI can stay overbought or oversold for a long time, so a reading above 70 is a weak reason to sell on its own. In a trend you flip the reading: wait for the oscillator to dip during a pullback and turn back with the trend, and still use a stop loss.
Nội dung này hiện chỉ có bản tiếng Anh.

In the previous lesson on oscillators, an RSI reading above 70 meant overbought and a reading below 30 meant oversold. In a sideways market those extremes often sit near turning points.
A strong trend changes that. Price can keep climbing while the oscillator sits in overbought territory, and selling every high reading becomes an expensive habit.
Why can a market stay overbought for so long?
Picture EUR/USD rising on the hourly chart from 1.10000 to 1.10500, with round illustrative prices. The 14-period RSI crosses 70 and reads 72. A trader sees overbought and sells 0.10 lot at 1.10500.
Price keeps rising to 1.10800, and RSI stays between 70 and 80 the whole way. The short is now 30 pips against the trader. On 0.10 lot of EUR/USD each pip is worth $1, so the open loss is $30.
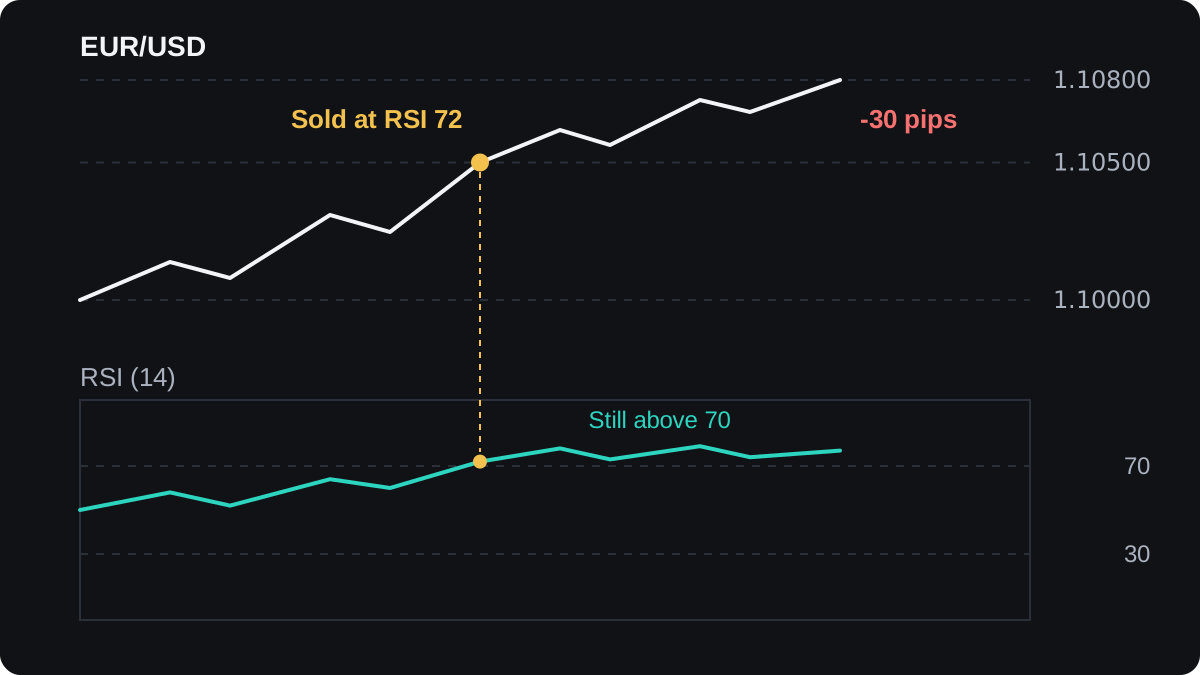
An overbought reading describes the recent past: up moves have been much larger than down moves over the last 14 candles. It carries no information about when buyers will stop.
What the RSI formula says about a trend
RSI compares the average size of up moves with the average size of down moves over the lookback period. The ratio of the two is called RS, and the indicator is RSI = 100 − 100 ÷ (1 + RS).
Redo it with simple numbers. Say that over the last 14 candles the average gain is 6 pips and the average loss is 2 pips:
- RS = 6 ÷ 2 = 3.
- 1 + RS = 4, and 100 ÷ 4 = 25.
- RSI = 100 − 25 = 75.
RSI reaches 70 when RS is about 2.33, because 100 ÷ 3.33 is about 30. So RSI stays above 70 for as long as up moves average more than about 2.33 times the size of down moves.
That is a fair description of a strong uptrend. The indicator is reporting the trend, and a high reading is what a healthy rise looks like.
Now take a pullback, a short move against the main trend, such as a dip inside an uptrend. Say the average gain and the average loss are both 4 pips. RS = 1, 100 ÷ 2 = 50, and RSI drops to 50, the midpoint.
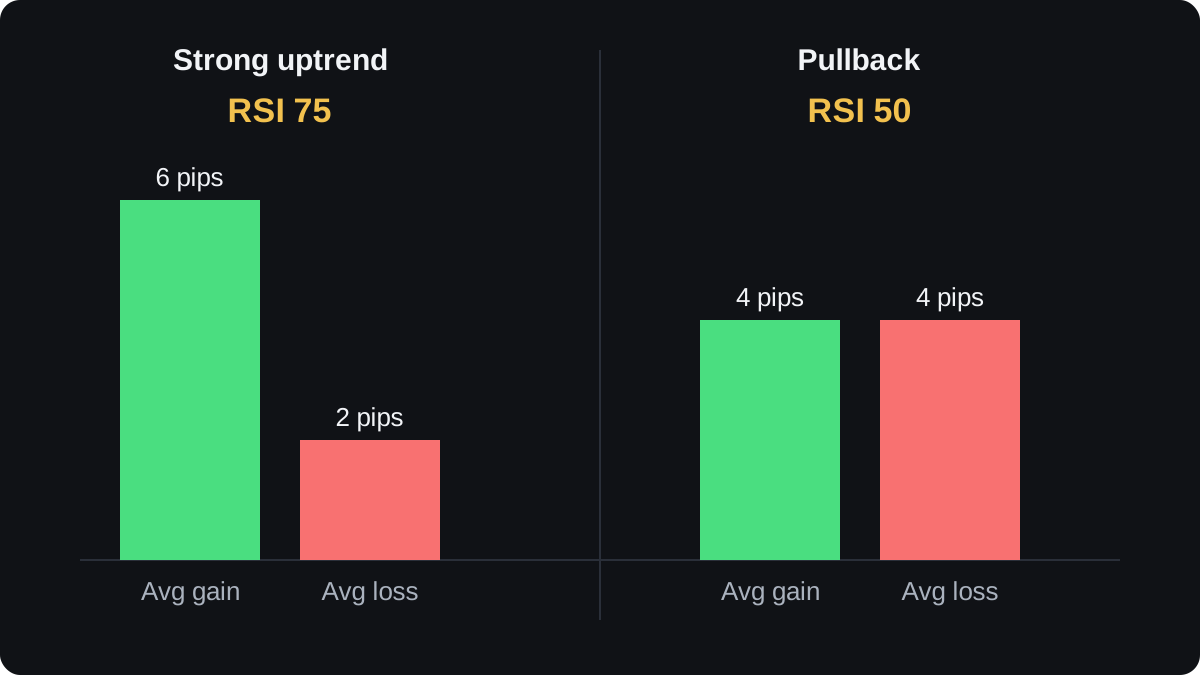
These sums use plain averages to keep the arithmetic easy. The standard RSI from J. Welles Wilder smooths the averages, which changes the exact readings without changing the idea.
The stochastic oscillator behaves the same way for its own reason. It measures where the close sits inside the recent high to low range, so a market that closes near its highs candle after candle keeps it above 80.
How do you know the market is trending?
Decide this on the price chart before you read the oscillator. An uptrend makes higher highs and higher lows, and a downtrend makes lower highs and lower lows.
The lesson on trending versus ranging markets covers the signs in detail. A simple filter helps when the swings are unclear: for example, treat the market as an uptrend only while price stays above a moving average that is itself rising.
The oscillator cannot make this call for you. A reading of 75 can appear near the start of a trend or right at its final high.
How do you read a pullback with an oscillator?
Inside a trend, pullbacks are where an oscillator becomes useful again. You read it the other way round.
In an uptrend, set overbought readings aside. Watch for the oscillator to fall during a dip and then turn back up.
In a downtrend, set oversold readings aside. Watch for a bounce that lifts the oscillator, then a turn back down.
With RSI, dips in an uptrend often hold above 30, so the 40 to 50 area is a common place to watch.
One rule of thumb shifts the RSI zones with the trend, to roughly 40 to 80 in an uptrend and 20 to 60 in a downtrend.
Those zones are chart-reading habits without firm proof behind them. Check them on your own pair and timeframe before you rely on them.
With stochastic in an uptrend, a common reading is a dip toward or below 20, followed by the faster %K line crossing back above the slower %D line.
The turn tells you more than the level. A reading of 44 that is still falling says the pullback is still running. A related signal, hidden divergence, compares pullback lows on price with lows on the oscillator.
A worked pullback trade on EUR/USD
Carry the same illustrative uptrend forward. EUR/USD tops at 1.10800 with RSI at 77, then pulls back to a low of 1.10400 while RSI falls to 44. The next hourly candle closes at 1.10450 and RSI turns up to 49.
A trader following the trend could plan it like this, with 0.10 lot and $1 per pip:
- Entry: buy at 1.10450, after RSI turns up.
- Stop loss: 1.10350, just under the pullback low. The distance is 1.10450 − 1.10350 = 0.00100, which is 10 pips.
- Risk: 10 pips × $1 = $10.
- Target: the earlier high at 1.10800. The distance is 1.10800 − 1.10450 = 0.00350, which is 35 pips, or $35.
- Reward to risk: 35 ÷ 10 = 3.5.
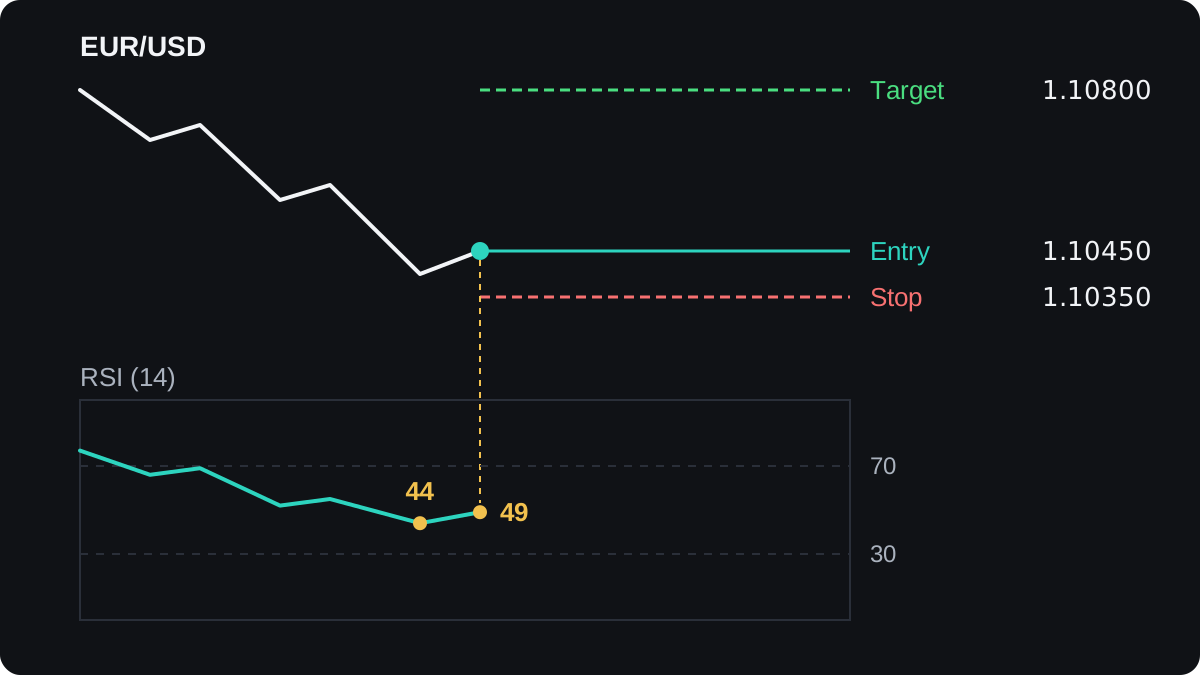
These figures ignore the spread and any commission, which would shave a little off the profit and add a little to the loss. Sizing the trade from the stop distance is covered in how to calculate position size.
The difference between the two trades is the plan. The overbought short had no exit decided in advance and was $30 down, while the pullback buy fixed its planned loss at $10 before entry.
Neither outcome is known in advance. A planned loss is not a smaller chance of losing, and this setup is an example only.
Where does this reading fail?
Trends end, and a reversal often begins with a move that looks like an ordinary pullback. If EUR/USD falls below 1.10350, the trade above loses $10 plus costs, or more if price gaps past the stop.
Late in a trend, price may make new highs while RSI makes lower highs. This bearish divergence can come before a top, yet in a strong trend it can also appear several times and fail each time.
Weak or choppy trends produce many small turns in the oscillator. Each one looks like a signal, and many lead nowhere.
The settings change the readings too. A 7-period RSI swings far more than a 14-period one, so a level that suits one setting will not suit the other.
Simple oscillator rules have a mixed record when tested, and results vary with the market and the period studied. Backtest any version on your own pair before trusting it.
Tools that measure the speed of price directly come next, in momentum indicators.
Câu hỏi thường gặp
Does overbought mean the price will fall?
No. It means up moves have outweighed down moves over the lookback period. In a strong uptrend, RSI can stay above 70 while price keeps climbing.
What RSI level marks a pullback in an uptrend?
There is no fixed level. The 40 to 50 area is a common place to watch, and a turn back up tells you more than the exact number.
Can you use stochastic the same way?
Yes. In an uptrend you set aside readings above 80 and watch for dips toward 20 that turn back up. With common settings it often swings more than a 14-period RSI, so it tends to give more signals, including more false ones.
Is oversold a buy signal in a downtrend?
Not on its own. In a strong downtrend RSI can stay below 30 for a long time, so the trend reading is a bounce toward 50 or 60 that then turns down.
Học tiếp
 Chương 1Leading and lagging indicators.A leading indicator tries to signal a turn before it happens, usually by measuring when a move is slowing, as RSI and the stochastic do. A lagging indicator, such as a moving average, confirms a move after it starts. Leading tools give more false alarms; lagging tools miss the start of each move.
 Chương 1What are oscillators?An oscillator is an indicator that moves back and forth inside a fixed range such as 0 to 100, or around a centre line such as zero. It compares the latest price with recent prices. A high reading means price is near the top of its recent range, and does not mean price must fall.
 Chương 1Momentum indicators and how to read them.A momentum indicator measures how fast price is changing by comparing the latest close with the close a set number of bars ago. When the line is above zero, price is higher than it was. A falling line means the move is slowing. It warns of a weakening trend but does not tell you when, or whether, price will reverse.
 Chương 1Oscillators and momentum cheat sheet.RSI and the stochastic run from 0 to 100 and are read at fixed levels such as 70 and 30. MACD, momentum and CCI have no fixed range and are read around a centre line. All are built from past prices, so an overbought reading can last through a strong trend and is not a sell signal by itself.

