Rectangles.
A rectangle is a sideways range where price bounces between two flat levels, resistance above and support below. It ends when price closes outside the box. Traders often sketch a target by adding the box's height to the broken level, but a rectangle can break either way and the break can fail.
Nội dung này hiện chỉ có bản tiếng Anh.

Sometimes a currency pair stops trending and spends days bouncing between the same two prices. Each rally stalls at one level and each dip stops at another.
On a chart that sideways stretch looks like a box. Chart readers call it a rectangle, and the moment price leaves the box is the part they plan around.
What does a rectangle look like on a chart?
Picture EUR/USD over two weeks, using illustrative prices. Every rally fades near 1.0900 and every dip finds buyers near 1.0800. Price tags the top four times and the bottom three times, and still goes nowhere.
A rectangle is a sideways range held between two roughly flat, parallel levels. The upper one is resistance, where selling has turned price down. The lower one is support, where buying has turned it up.
A common rule of thumb is at least two touches on each level. With fewer, you are drawing a box the market has not confirmed yet.
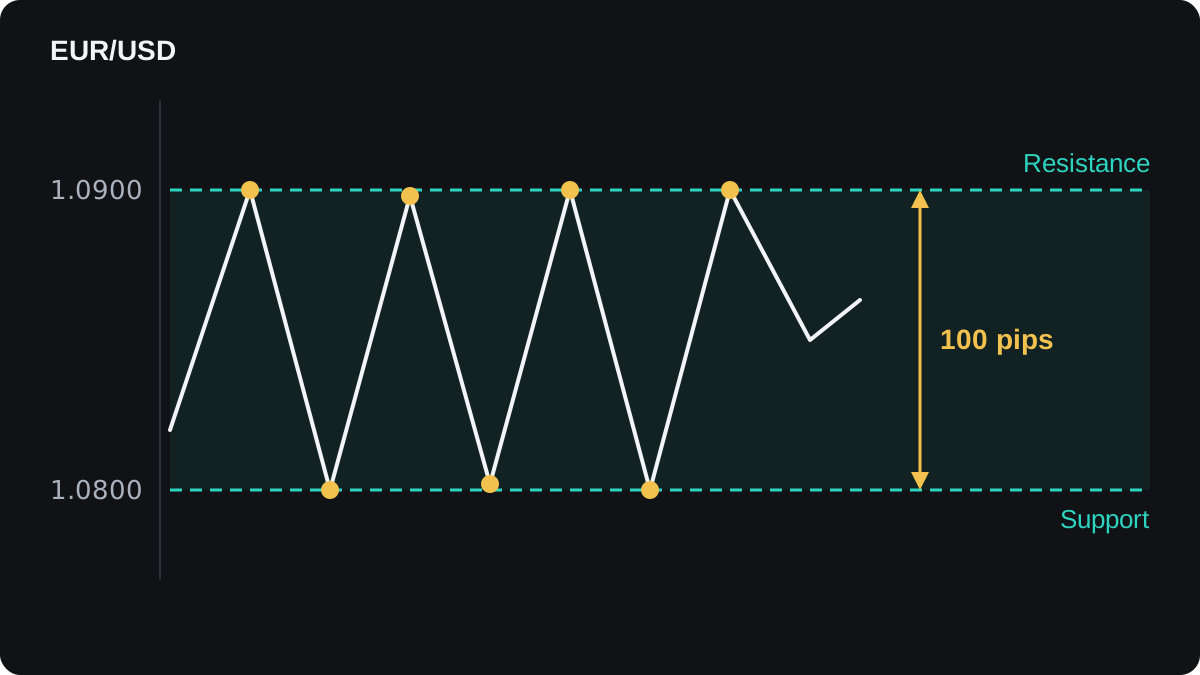
The gap between the levels is the rectangle's height. Here it is 1.0900 minus 1.0800 = 0.0100, which is 100 pips. That number comes back when you sketch a target.
Real boundaries are a little ragged. One rally may stop at 1.0897 and the next at 1.0904, so treat each edge as a narrow band. The lesson on support and resistance zones explains why.
How it differs from triangles, flags and channels
A triangle has at least one sloping side, so its range narrows over time. A rectangle keeps the same height from its first touch to its last.
A flag is a short pause after a sharp move, usually tilted against that move. A rectangle can last much longer and stays flat. The flags and pennants lesson covers the shorter pause.
A channel also has parallel sides, but they slope. Once the edges of your box start to tilt, you are looking at a channel. You may also hear a rectangle called a trading range, a consolidation or simply a box.
What does a rectangle say about buyers and sellers?
Inside the box, neither side is winning. Buyers step in near support and sellers near resistance, so price keeps travelling between them.
Traditional charting books usually list the rectangle as a continuation pattern, while noting that it can also mark a reversal. Continuation means price is expected to leave in the direction of the trend that came before the box.
It can break either way, and the box itself gives no dependable clue which, so plan for both edges.
Stock chart guides often add that volume shrinks inside a rectangle and jumps on the breakout. Spot forex has no central exchange, so there is no single volume figure to check.
Trading platforms show tick volume instead, which counts how many times the price changed. It says nothing direct about the amount of money traded.
What happens when price breaks out?
A breakout is a move out of the box. A wick that pokes through and snaps back proves little, so a common filter is to wait for a candle to close beyond the level.
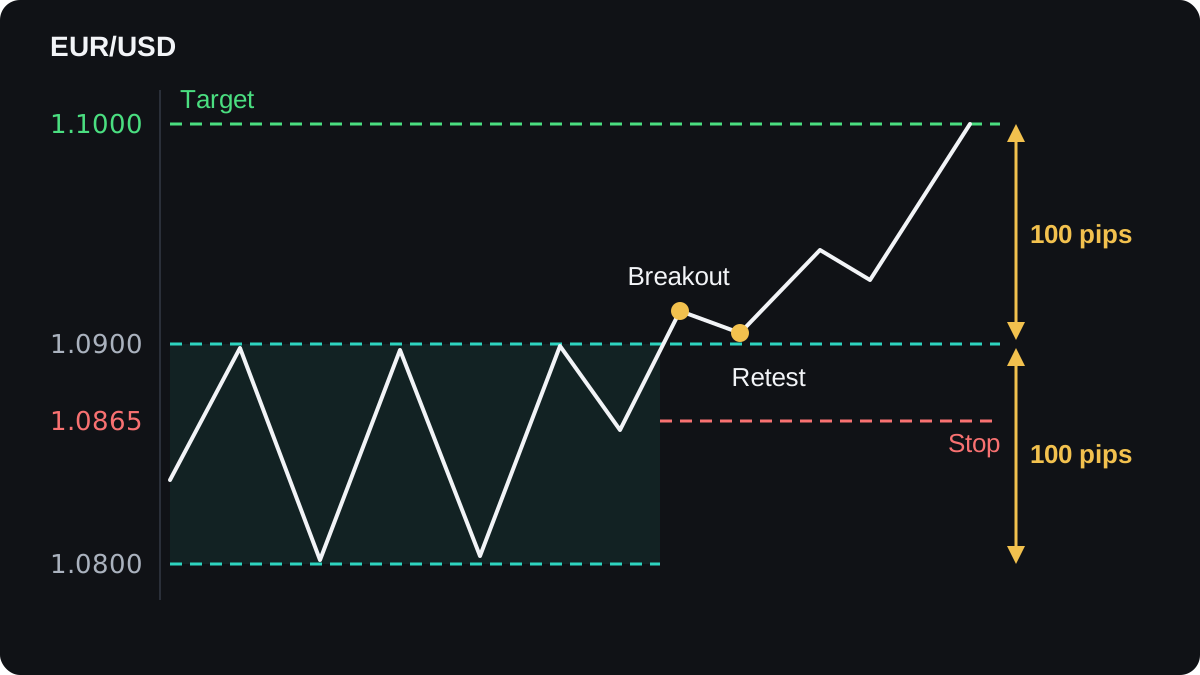
Price sometimes returns to test the boundary it just broke. If old resistance at 1.0900 now holds as support, that retest adds some weight to the break. The idea is covered in when support becomes resistance.
The usual way to sketch a target is the measured move: project the rectangle's height from the broken level. For an upside break of the EUR/USD box, that is 1.0900 + 0.0100 = 1.1000.
For a downside break you subtract instead. Suppose USD/JPY ranges between 148.00 and 149.50. The height is 1.50, which is 150 pips, because a yen pip is 0.01.
A close below 148.00 then points to 148.00 minus 1.50 = 146.50. On a 0.10 lot short, a pip is 10,000 × 0.01 = ¥100, so the full 150 pip move would be worth ¥15,000, about $102.39 at 146.50.
Treat the measured target as a rough guide. It comes from charting tradition, and price can stall well short of it or run far past it.
How do you work out risk and target on a breakout?
Take the EUR/USD box again, with round illustrative numbers and no trading costs.
- The box runs from 1.0800 to 1.0900, a height of 100 pips, so the measured target is 1.1000.
- A candle closes at 1.0915, above resistance, and you buy 0.20 lot at 1.0915.
- You put the stop at 1.0865, back inside the box, where a return would suggest the break has failed. That is 1.0915 minus 1.0865 = 0.0050, or 50 pips.
- The target is 1.1000 minus 1.0915 = 0.0085, or 85 pips away.
- On 0.20 lot, which is 20,000 euros, one pip is 20,000 × 0.0001 = $2. You risk 50 × $2 = $100 to aim for 85 × $2 = $170.
Waiting for a retest changes the sums. Say price dips back to 1.0905 after the break and you buy there instead, with the same stop and target.
| Entry | Price | Stop distance | Target distance | Risk on 0.20 lot | Reward on 0.20 lot |
|---|---|---|---|---|---|
| Breakout close | 1.0915 | 50 pips | 85 pips | $100 | $170 |
| Retest | 1.0905 | 40 pips | 95 pips | $80 | $190 |
The retest entry has a risk-reward ratio of about 2.4 to 1, against 1.7 to 1 for the breakout close. The cost is that price may never come back, and then you have no trade.
Both entries use the same map: a stop at 1.0865 inside the box and a target at 1.1000, one box height above resistance.
Real trades also pay the spread and any commission, which shrink the gain and deepen the loss. Size the position from the stop distance, as shown in how to calculate position size.
Can you trade inside the range?
Some traders work the box itself, buying near support and selling near resistance with stops just outside. In the EUR/USD example, that could be a buy at 1.0805 with a stop at 1.0780 and a target at 1.0890.
That trade risks 1.0805 minus 1.0780 = 25 pips to make 1.0890 minus 1.0805 = 85 pips. The room is always smaller than the box, because you leave a gap at each edge.
The approach depends on the range lasting. When it ends, the trade on the wrong side of the break is the one that gets stopped, and a fast move can slip past the stop price.
A trade from the middle of the box has no nearby level to define its risk, which is why range traders wait for the edges.
Why do rectangle breakouts fail?
A frequent problem is the false breakout. Price closes beyond the level, pulls in breakout buyers, then drops back inside the box.
In the chart below, the candle that closes at 1.0915 looks like a clean break. The next one tops out at 1.0925 and closes at 1.0872, and the one after falls through the 1.0865 stop.
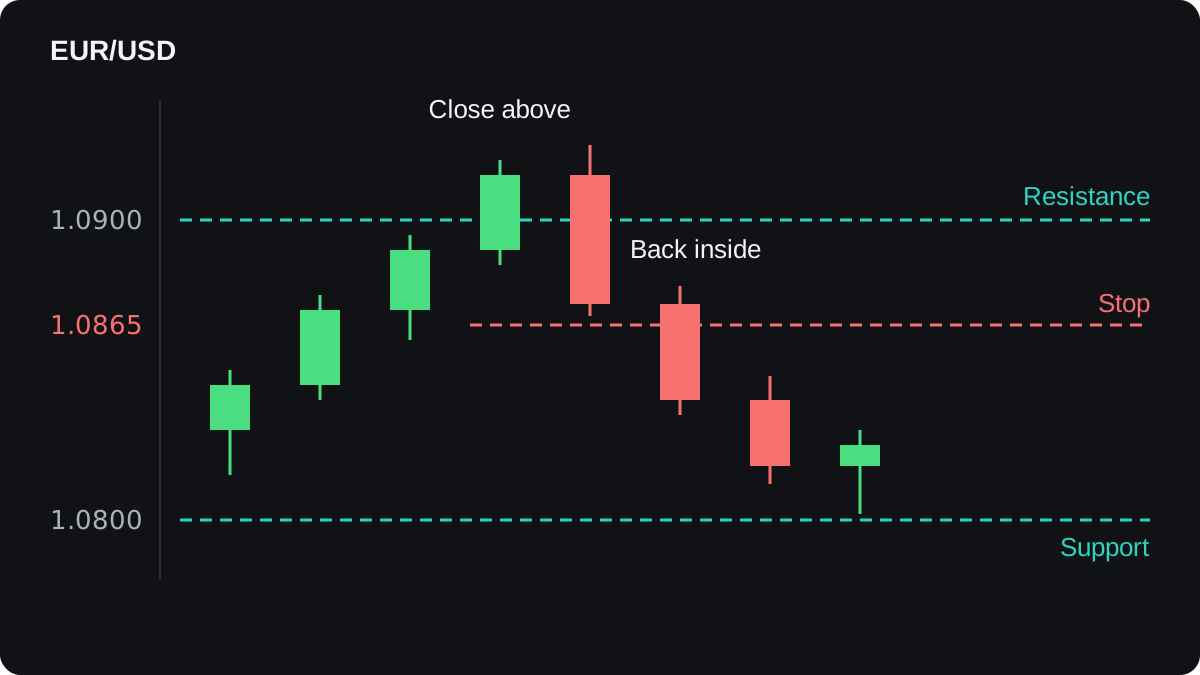
The false breakouts lesson looks at ways traders try to filter these, and none of those filters removes the problem.
Rectangles also look clearer in hindsight than while they form. A level that seems obvious after six touches was a guess after two.
News releases can push price through a boundary for a few minutes and drag it straight back. A wide box adds its own cost: the stop sits further away, so the same risk buys a smaller position.
Published tests of chart patterns disagree, partly because each one defines the pattern differently. Use the rectangle as a way to plan around two levels, and test any rules on a demo account before using real money.
Câu hỏi thường gặp
Is a rectangle pattern bullish or bearish?
On its own it is a pause with no direction. It turns bullish or bearish only when price closes outside the top or the bottom of the box.
How many touches make a rectangle?
A common rule of thumb is at least two on each level. More touches make the levels easier to see, but they say nothing about which way the break will go.
How do you set a target for a rectangle breakout?
Measure the height and add it to the broken level for an upside break, or subtract it for a downside break. A 100 pip box broken upward at 1.0900 gives 1.1000, as a rough guide only.
What is the difference between a rectangle and a channel?
Both have parallel boundaries. A rectangle's boundaries are flat, while a channel's slope up or down.
Where should the stop go on a rectangle breakout?
A common choice is back inside the box, so a return into the range closes the trade. The further inside it sits, the smaller the position you can take for the same risk.
Học tiếp
 Chương 2Head and shoulders.A head and shoulders is a chart pattern of three peaks, with the middle one highest, that can mark the end of an uptrend. The neckline joins the two lows between the peaks. Traders treat a close below it as the trigger and measure a target by projecting the head's height down from the break.
 Chương 2Double tops and double bottoms.A double top is two peaks at about the same price with a dip between them; a double bottom is two lows with a bounce between. The low or high between them is the neckline. The pattern only counts once price closes beyond the neckline, and it can still fail after that.
 Chương 2Ascending, descending and symmetrical triangles.A triangle is a pattern where price swings narrow between two converging trend lines. An ascending triangle has a flat top and rising lows, a descending triangle a flat bottom and falling highs, and a symmetrical triangle slopes on both sides. Each can break either way, so a common rule is to wait for a close outside the lines.
 Chương 2Rising and falling wedges.A wedge is a chart pattern where price swings between two trend lines that slope the same way and move closer together. A rising wedge slopes up and is usually read as bearish. A falling wedge slopes down and is usually read as bullish. Neither is reliable on its own, so traders wait for a confirmed break.
 Chương 2Flags and pennants.A flag is a short, narrow channel that slopes against a sharp price move, called the pole. A pennant is the same pause shaped like a small triangle. Traders read both as a rest before the move continues. A common plan trades the break in the pole's direction and projects the pole's length as a rough target.
 Chương 2Chart patterns cheat sheet.Most chart patterns share one set of rules. Enter when a candle closes beyond the pattern's boundary, put the stop beyond the opposite side or the last swing, and aim for the pattern's height projected from the breakout, or the pole's length for flags and pennants. This sheet gives each pattern's entry, stop and target.

