Double tops and double bottoms.
A double top is two peaks at about the same price with a dip between them; a double bottom is two lows with a bounce between. The low or high between them is the neckline. The pattern only counts once price closes beyond the neckline, and it can still fail after that.
本頁目前僅提供英文版。

Price climbs to 1.10500 on EUR/USD, gets pushed back, rallies again and stalls at almost the same price. Buyers have tried the level twice and failed both times. That shape is a double top, and its mirror image after a fall is a double bottom.
Both are reversal patterns, meaning they hint that the move before them may be ending. Neither counts until price breaks a level called the neckline, and both can still fail after that break.
What does a double top look like?
A double top forms after a rise. Price makes a high, pulls back to a low, rallies to a second high near the first one, then turns down again.
The low between the two peaks is the neckline. You met the same idea in the head and shoulders lesson: it is the line that decides whether the pattern is real.
The peaks rarely match to the pip. In this illustrative example they are 2 pips apart, at 1.10500 and 1.10480. What matters is that the second rally stopped at the same resistance as the first.
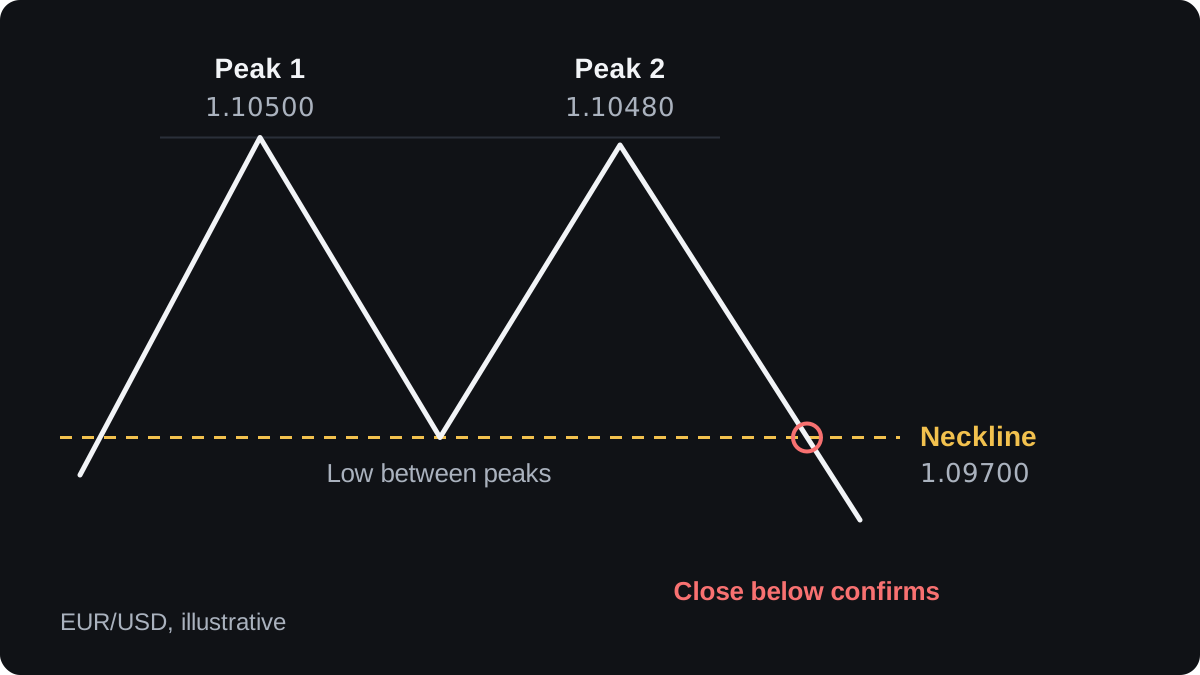
The dip between the peaks should be easy to see. Two highs a few candles apart with a tiny wobble between them are a pause in the trend. Traders usually look for a clear swing and some time between the two tests.
When is a double top confirmed?
Before the neckline breaks, all you have is two highs and a range. Price can still bounce off 1.09700 and go on to break above both peaks.
The usual rule is to wait for a candle to close below the neckline on the timeframe you are watching. A wick that pokes through and closes back above the line does not count.
Some traders wait for a retest as well: price climbs back to the broken neckline, fails there and turns down. That filter removes some false signals, but the entry price is worse and sometimes the retest never comes.
How do traders set a target and a stop?
The common target is the measured move: take the height of the pattern, from peak to neckline, and project it from the neckline in the direction of the break. With the same illustrative prices:
- Height: 1.10500 − 1.09700 = 0.00800, which is 80 pips.
- Target: 1.09700 − 0.00800 = 1.08900.
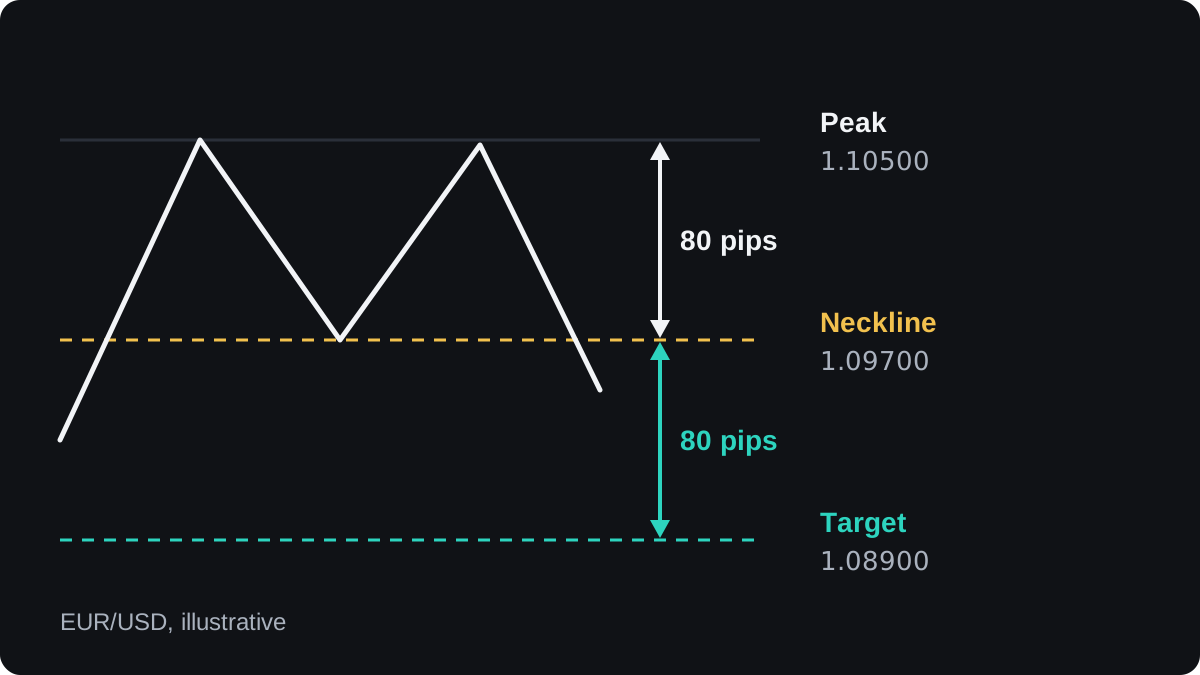
Treat 1.08900 as a rough guide. Price may stall at older support well before it or run far beyond it. The measured move is a habit traders share, and the market has no reason to respect it exactly.
Now the stop. Suppose a candle closes at 1.09650 and you sell 0.10 lot there. A pip on 0.10 lot of EUR/USD is 10,000 × 0.0001 = $1, so the target 75 pips away is worth $75 (1.09650 − 1.08900 = 0.00750).
Two common stop placements give very different trades:
| Stop placement | Stop price | Risk | Reward to target |
|---|---|---|---|
| Above both peaks | 1.10550 | 90 pips, $90 | 75 pips, $75 |
| Middle of the pattern | 1.10100 | 45 pips, $45 | 75 pips, $75 |
The first stop is 1.10550 − 1.09650 = 0.00900, or 90 pips. The second sits halfway between peak and neckline, at 1.10100, which is 0.00450 or 45 pips from entry.
The wide stop sits where the pattern is plainly wrong, yet it risks more than the target pays. The tight stop gives a better ratio but gets hit more often by ordinary swings.
The risk-reward lesson explains why the ratio means little without the win rate.
Whichever you pick, set the lot size from the stop distance. The position size lesson walks through that step.
How does a double bottom work?
A double bottom is the same pattern upside down. Price falls to a low, bounces, falls back to about the same low and turns up. The neckline is the high between the two lows, and a close above it confirms the pattern.
Here is an illustrative USD/JPY example. On a JPY pair a pip is 0.01.
- Lows at 148.00 and 148.10, with the high between them at 149.60.
- Height: 149.60 − 148.00 = 1.60, which is 160 pips.
- Target: 149.60 + 1.60 = 151.20.
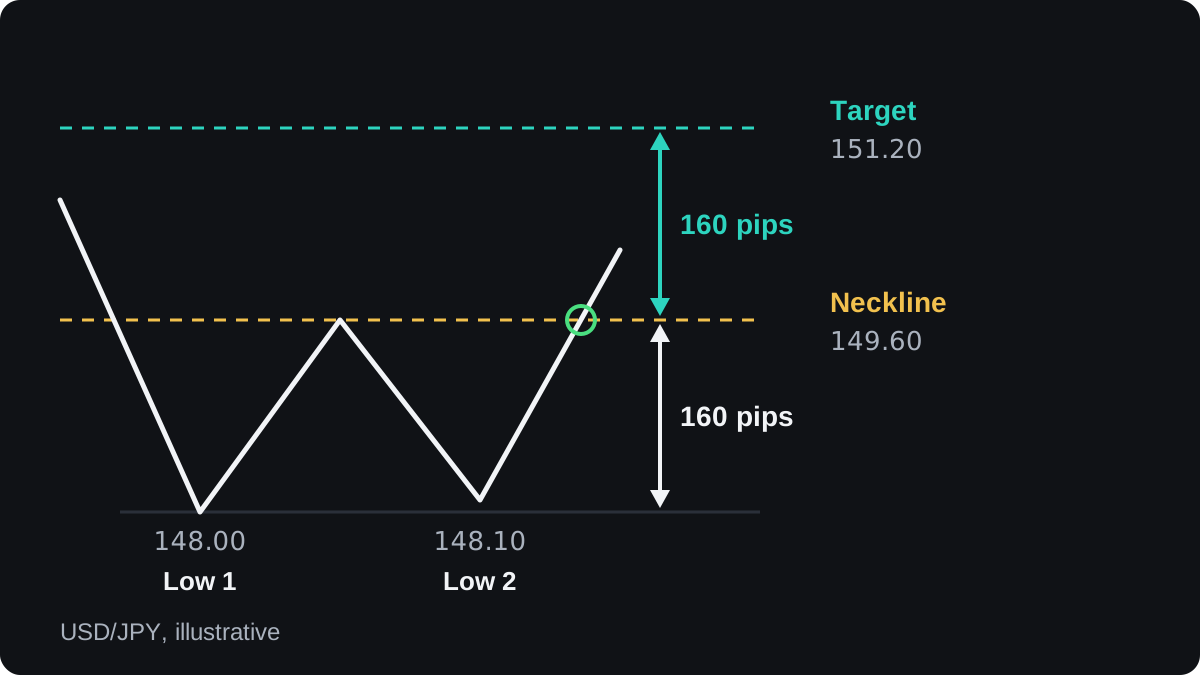
Say a candle closes at 149.70, you buy 0.10 lot there and place the stop at 147.90, below both lows. On 0.10 lot a pip is 10,000 × 0.01 = ¥100.
- Risk: 149.70 − 147.90 = 1.80, or 180 pips. That is 180 × ¥100 = ¥18,000, or ¥18,000 ÷ 147.90 = $121.70 if the stop is hit.
- Reward: 151.20 − 149.70 = 1.50, or 150 pips. That is 150 × ¥100 = ¥15,000, or ¥15,000 ÷ 151.20 = $99.21 at the target.
The yen amounts are exact, while the dollar amounts depend on the rate when the trade closes. The pip value calculator does this conversion for other pairs and sizes.
Where do double tops and bottoms go wrong?
One failure is a false break. Price closes beyond the neckline, then swings back inside the pattern within a few candles, and traders who acted on the break are stopped out. The false breakouts lesson covers this in detail.
Once you start looking for double tops, any two highs at a similar price can look like one. Many of them end with price breaking upward instead, and you only learn which kind it was afterwards.
Textbook examples, including the ones here, are chosen after the outcome is known. On a live chart the second peak may still be forming, and the neckline may never break.
Tests of chart patterns have produced mixed results, and the answers depend heavily on how the pattern is defined and whether trading costs are counted. There is no reliable win rate to quote for double tops or bottoms.
Context changes the weight of a pattern. Traders usually give more weight to one that forms at a long-standing level on a daily chart than to one on a 5-minute chart, where the spread can eat a large share of a small target.
The next lesson, on triangle patterns, looks at ranges that narrow into a point before they break.
常見問題
Is a double top bullish or bearish?
It is bearish once confirmed: after price closes below the neckline, it suggests a rise may be turning into a fall. A double bottom is the bullish version.
How close do the two peaks need to be?
There is no official tolerance. A common habit is to compare the gap with the pattern's height, so a 2 pip gap on an 80 pip pattern is a clear match.
What if the second peak goes higher than the first?
A small overshoot that closes back below the first peak is often still read as a double top. If price closes well above the first peak and holds there, the resistance has broken and the pattern no longer applies.
What is a triple top?
A triple top tests the same level three times instead of two. The neckline, the confirmation and the measured move work the same way.
Which timeframe is best for double tops?
The pattern appears on every timeframe. Daily and weekly patterns take longer to form and need wider stops, while short timeframe patterns appear more often and lose more to the spread relative to their size.
繼續學習
 第 2 章Head and shoulders.A head and shoulders is a chart pattern of three peaks, with the middle one highest, that can mark the end of an uptrend. The neckline joins the two lows between the peaks. Traders treat a close below it as the trigger and measure a target by projecting the head's height down from the break.
 第 2 章Ascending, descending and symmetrical triangles.A triangle is a pattern where price swings narrow between two converging trend lines. An ascending triangle has a flat top and rising lows, a descending triangle a flat bottom and falling highs, and a symmetrical triangle slopes on both sides. Each can break either way, so a common rule is to wait for a close outside the lines.
 第 2 章Rising and falling wedges.A wedge is a chart pattern where price swings between two trend lines that slope the same way and move closer together. A rising wedge slopes up and is usually read as bearish. A falling wedge slopes down and is usually read as bullish. Neither is reliable on its own, so traders wait for a confirmed break.
 第 2 章Flags and pennants.A flag is a short, narrow channel that slopes against a sharp price move, called the pole. A pennant is the same pause shaped like a small triangle. Traders read both as a rest before the move continues. A common plan trades the break in the pole's direction and projects the pole's length as a rough target.
 第 2 章Rectangles.A rectangle is a sideways range where price bounces between two flat levels, resistance above and support below. It ends when price closes outside the box. Traders often sketch a target by adding the box's height to the broken level, but a rectangle can break either way and the break can fail.
 第 2 章Chart patterns cheat sheet.Most chart patterns share one set of rules. Enter when a candle closes beyond the pattern's boundary, put the stop beyond the opposite side or the last swing, and aim for the pattern's height projected from the breakout, or the pole's length for flags and pennants. This sheet gives each pattern's entry, stop and target.

