Head and shoulders.
A head and shoulders is a chart pattern of three peaks, with the middle one highest, that can mark the end of an uptrend. The neckline joins the two lows between the peaks. Traders treat a close below it as the trigger and measure a target by projecting the head's height down from the break.
本頁目前僅提供英文版。

Picture a pair that has climbed for weeks. It makes a high and dips. It then pushes to a higher high, dips again, and tries once more, but stalls below the last peak.
That shape, three peaks with the middle one tallest, is a head and shoulders. It suggests buyers are losing strength. It is also easy to imagine on a chart where none exists.
What does a head and shoulders look like?
The pattern forms after an uptrend. The left shoulder is the first peak. The head is a higher peak after it. The right shoulder is a third peak, lower than the head and often close to the height of the left shoulder.
Between the peaks sit two lows. The line through those two lows is the neckline, and a trade on this pattern is built around it.
This lesson uses one example throughout, with round illustrative EUR/USD prices. The left shoulder tops at 1.1050, the head at 1.1120 and the right shoulder at 1.1060. Both lows sit at 1.1000.
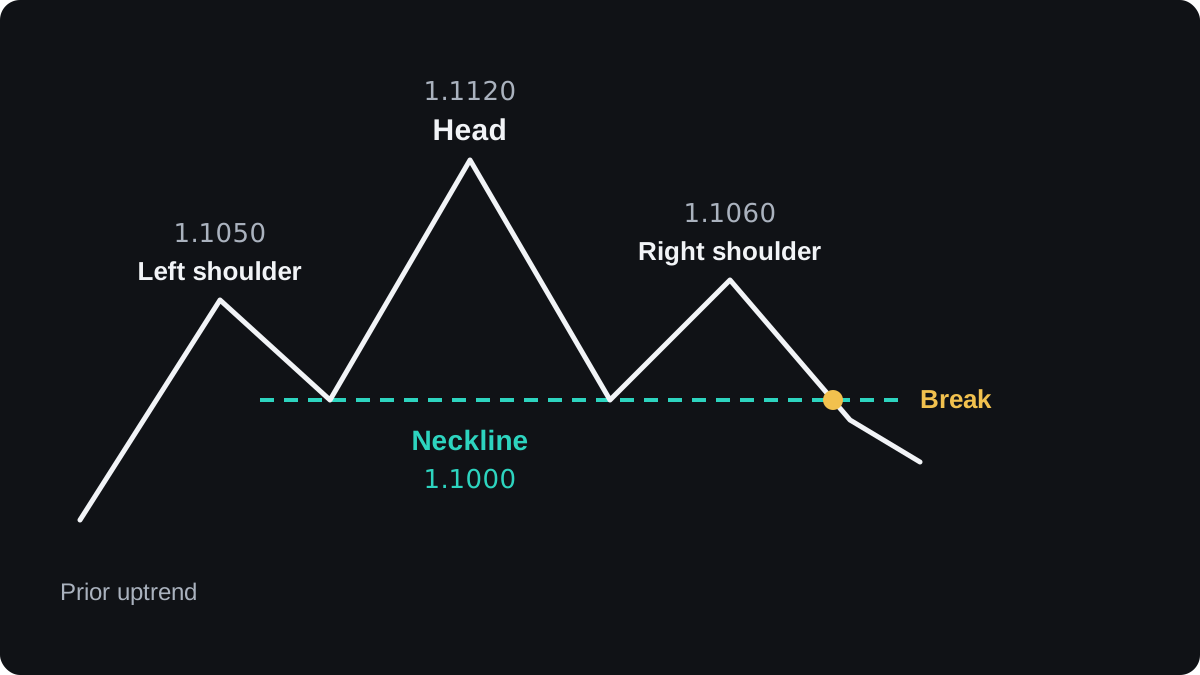
In terms of market structure, the right shoulder is the first lower high after a run of higher highs. The pattern is a picture of that change.
How do you draw the neckline?
Connect the low between the left shoulder and the head to the low between the head and the right shoulder. In the example both lows are at 1.1000, so the neckline is flat.
Real charts are rarely that tidy. The two lows often differ, so the neckline slopes up or down. A downward slope means the second low came in below the first, so buyers had already given ground before any break.
Like any support level, the neckline is better treated as a zone a few pips wide.
Drawing through candle closes and drawing through wick lows can give two different lines. Pick one method and use it every time.
When is the pattern complete?
Until price breaks the neckline, you only have three peaks and a guess. Price can bounce off the neckline and climb to new highs, and then there was never a top at all.
The usual confirmation is a candle that closes below the neckline on the timeframe where the pattern formed. A brief dip that closes back above the line does not count.
After the break, price sometimes rises back to the neckline before falling again. In that retest, old support has turned into resistance, as the lesson on when support becomes resistance explains.
The retest does not always come, so a plan that waits for it will miss some moves.
Stock chartists often look for falling volume on the right shoulder as extra evidence. Spot forex has no central exchange, so your platform usually shows tick volume, a count of price changes, which is only a rough stand-in for real volume.
How do traders measure the target?
The usual method is a measured move. You take the height of the head above the neckline and project the same distance down from the point where price broke.
With the example prices:
- The head high is 1.1120.
- The neckline directly below the head is 1.1000.
- The height is 1.1120 minus 1.1000 = 0.0120, which is 120 pips.
- The break happens at the neckline, 1.1000.
- The target is 1.1000 minus 0.0120 = 1.0880.
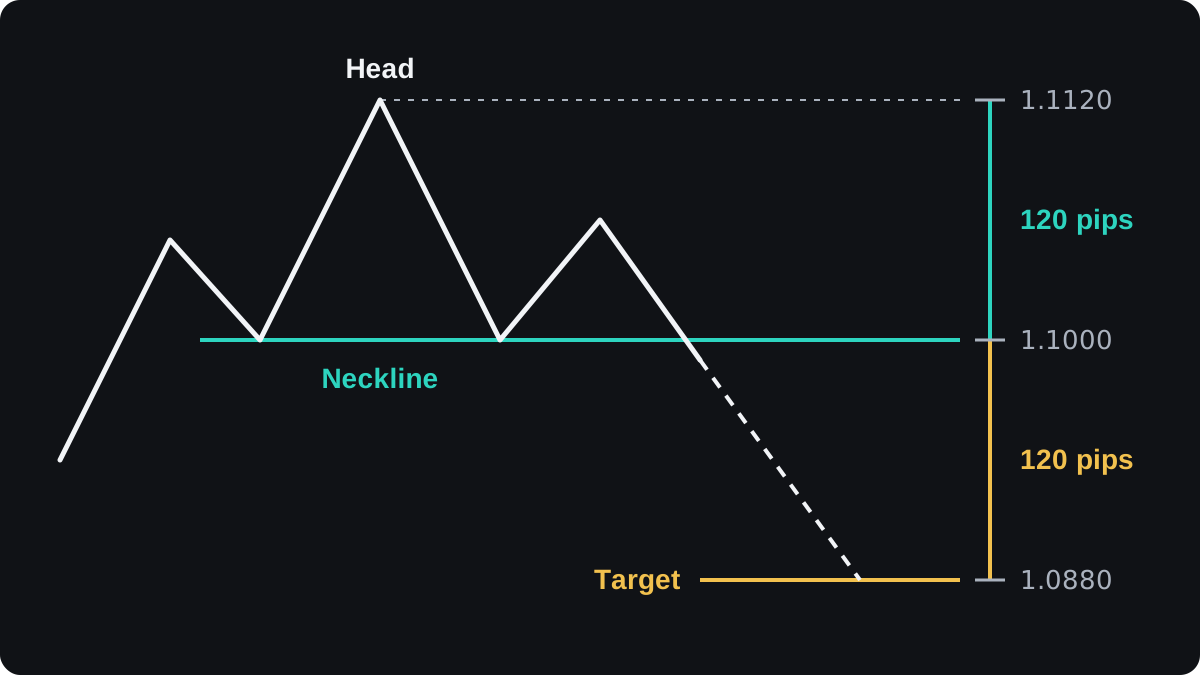
With a sloped neckline, measure from the head straight down to the neckline at the same point in time. Then project that distance from wherever price actually crossed the line.
Say the neckline sits at 1.0990 directly below the head, and price breaks it later at 1.0975. The height is 1.1120 minus 1.0990 = 130 pips, so the target is 1.0975 minus 0.0130 = 1.0845.
The target is a rough guide. Price can stall well before it or run far past it, and the measured move says nothing about how long the trip will take.
A worked trade plan on EUR/USD
This shows how the flat example turns into numbers you can check. It illustrates the arithmetic and is no recommendation to take the trade. Prices are round and illustrative, and the spread is ignored to keep the sums clean.
- A candle closes below the 1.1000 neckline, and you sell 0.10 lot at 1.0990.
- You place the stop above the right shoulder: 1.1060 plus a 10 pip buffer = 1.1070.
- The risk is 1.1070 minus 1.0990 = 0.0080, which is 80 pips.
- The target from the measured move is 1.0880, so the reward is 1.0990 minus 1.0880 = 0.0110, which is 110 pips.
- On 0.10 lot of EUR/USD, one pip is 10,000 × 0.0001 = $1, so the risk is $80 and the reward is $110.
- Reward to risk is 110 ÷ 80 = 1.375, about 1.4 to 1.
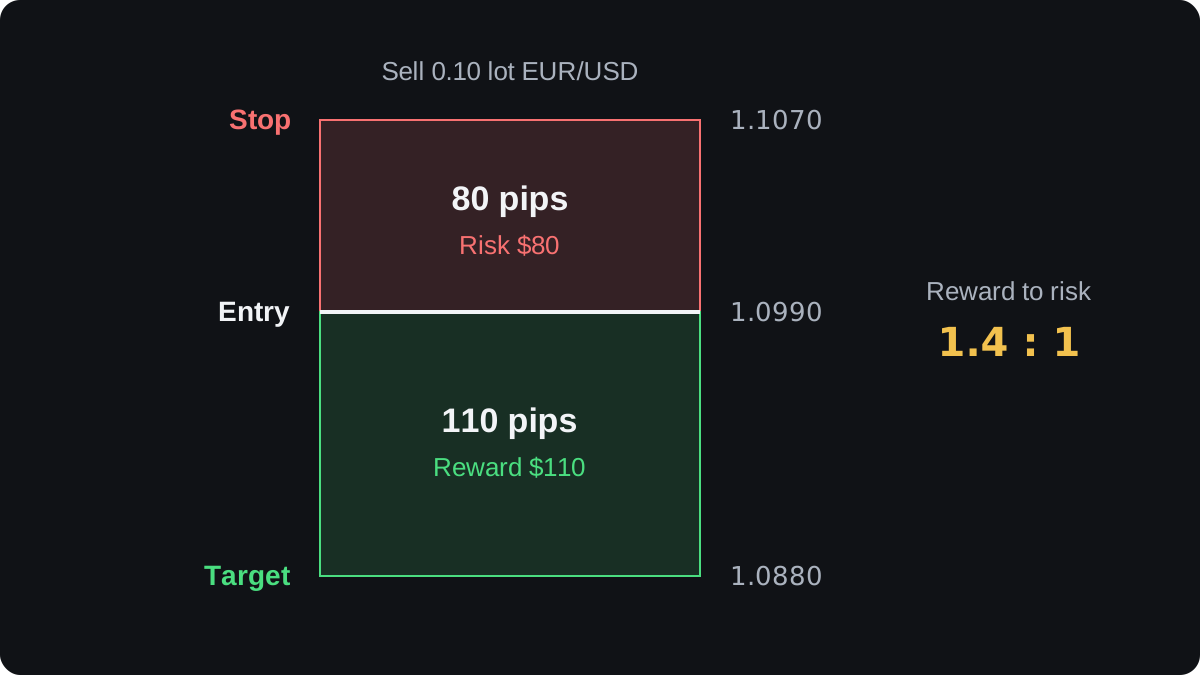
A stop above the head, at 1.1120 plus the same 10 pip buffer = 1.1130, would widen the risk to 1.1130 minus 1.0990 = 140 pips. The target stays put.
The ratio would drop to 110 ÷ 140 = 0.79 to 1, so the stop choice changes the trade as much as the pattern does. The risk-reward ratio lesson covers how that ratio interacts with win rate.
To risk a fixed amount, divide it by the stop distance. With $40 at risk and an 80 pip stop, you can afford $0.50 per pip, which is 0.05 lot of EUR/USD. The lot size calculator does this for any pair and account currency.
What is an inverse head and shoulders?
Turn the pattern upside down and you get the inverse head and shoulders, a possible bottom after a downtrend. It has three lows, the middle one deepest, and a neckline through the two highs between them.
The rules mirror the top. Confirmation is a close above the neckline, and the target is the depth of the head projected up from the break.
Take an illustrative USD/JPY case where the head bottoms at 148.00 and the neckline sits at 150.00. On a yen pair a pip is 0.01, so the depth of 2.00 is 200 pips, and the target is 150.00 plus 2.00 = 152.00.
On 0.10 lot, a USD/JPY pip is 10,000 × 0.01 = ¥100. A buy at the 150.00 break that reached the target would gain 200 × ¥100 = ¥20,000, which is about $131.58 when converted at 152.00.
Where does the pattern fail?
Price can close below the neckline and then close back above it a few candles later. That is a false breakout, and a sell taken on the first close would be losing unless the stop limited the damage.
The right shoulder can also keep rising past the head. At that point the shape is a higher high in an ongoing uptrend, and the top you were watching never formed.
Spotting the pattern is subjective. Two people looking at the same chart can disagree about where the shoulders are and where the neckline sits.
Hindsight also makes clean examples easy to find on old charts and much harder to find in real time.
Published tests of the pattern in currency markets have given mixed results, and the outcome depends heavily on how the pattern is defined. Treat it as one piece of evidence, and keep a stop loss on every trade built on it.
A close relative has two peaks instead of three, and the next lesson covers double tops and double bottoms.
常見問題
Is head and shoulders bullish or bearish?
The standard pattern is bearish. It forms after an uptrend and points to a possible fall once the neckline breaks. The inverse version is bullish and forms after a downtrend.
How reliable is the head and shoulders pattern?
No chart pattern is reliable on its own. Tests give mixed results that depend on how the pattern is defined, and false breaks of the neckline do happen, so a stop loss belongs in any plan built on it.
How do you calculate the head and shoulders target?
Measure the distance from the head to the neckline directly below it, then subtract that distance from the breakout point. With a head at 1.1120 and a neckline at 1.1000, the 120 pip height gives a target of 1.0880.
Where do you put the stop loss on a head and shoulders?
A common choice is just above the right shoulder, with a small buffer. A stop above the head is less likely to be hit by noise but much wider, which shrinks the reward to risk ratio.
Does the pattern appear on every timeframe?
The shape can appear on any timeframe, from minutes to weeks. On short timeframes it forms and fails faster, and the spread takes a larger share of a small target.
繼續學習
 第 2 章Double tops and double bottoms.A double top is two peaks at about the same price with a dip between them; a double bottom is two lows with a bounce between. The low or high between them is the neckline. The pattern only counts once price closes beyond the neckline, and it can still fail after that.
 第 2 章Ascending, descending and symmetrical triangles.A triangle is a pattern where price swings narrow between two converging trend lines. An ascending triangle has a flat top and rising lows, a descending triangle a flat bottom and falling highs, and a symmetrical triangle slopes on both sides. Each can break either way, so a common rule is to wait for a close outside the lines.
 第 2 章Rising and falling wedges.A wedge is a chart pattern where price swings between two trend lines that slope the same way and move closer together. A rising wedge slopes up and is usually read as bearish. A falling wedge slopes down and is usually read as bullish. Neither is reliable on its own, so traders wait for a confirmed break.
 第 2 章Flags and pennants.A flag is a short, narrow channel that slopes against a sharp price move, called the pole. A pennant is the same pause shaped like a small triangle. Traders read both as a rest before the move continues. A common plan trades the break in the pole's direction and projects the pole's length as a rough target.
 第 2 章Rectangles.A rectangle is a sideways range where price bounces between two flat levels, resistance above and support below. It ends when price closes outside the box. Traders often sketch a target by adding the box's height to the broken level, but a rectangle can break either way and the break can fail.
 第 2 章Chart patterns cheat sheet.Most chart patterns share one set of rules. Enter when a candle closes beyond the pattern's boundary, put the stop beyond the opposite side or the last swing, and aim for the pattern's height projected from the breakout, or the pole's length for flags and pennants. This sheet gives each pattern's entry, stop and target.

