Hidden divergence.
Hidden divergence is when price and an oscillator disagree in a way that suggests the trend may continue. In an uptrend, price makes a higher low while the oscillator makes a lower low. In a downtrend, price makes a lower high while the oscillator makes a higher high. It is a weak signal on its own.
本頁目前僅提供英文版。

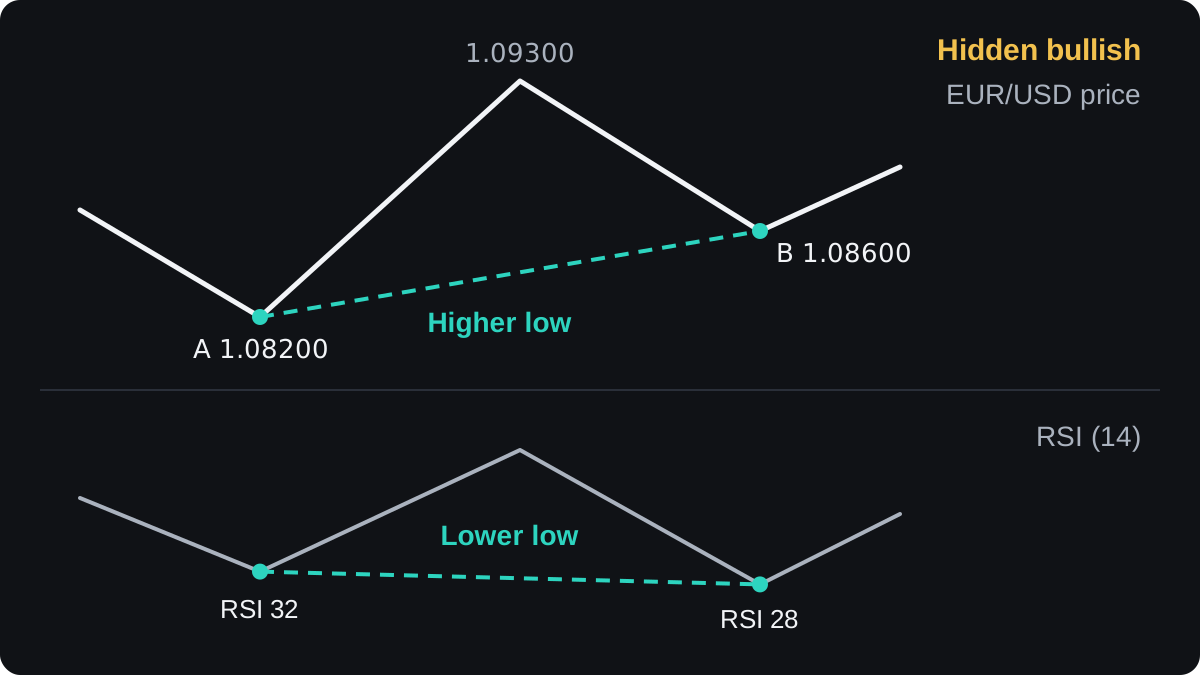
Picture EUR/USD in a steady uptrend. It pulls back to 1.08600, well above its last low of 1.08200.
Yet the RSI below the chart sinks lower than it did at that earlier low. Price held up while the indicator dipped.
That mismatch is called hidden divergence. Regular divergence hints that a trend may be turning. Hidden divergence hints that a pullback may be ending and the trend may carry on.
What does hidden divergence look like?
Any divergence compares two swing points on price with the same two points on an oscillator. The divergence basics lesson covers the general idea.
Hidden divergence follows the direction of the trend. In an uptrend you compare two lows. In a downtrend you compare two highs.
In the opening example, low A is 1.08200 with the 14-period RSI at 32. Low B is 1.08600 with the RSI at 28. Price made a higher low, 40 pips above A, while the RSI made a lower low.
All prices and readings in this lesson are round illustrative numbers.
What are hidden bullish and hidden bearish divergence?
A hidden bullish divergence appears in an uptrend: price makes a higher low and the oscillator makes a lower low. It suggests buyers stepped in at a higher price than last time, so the uptrend may resume.
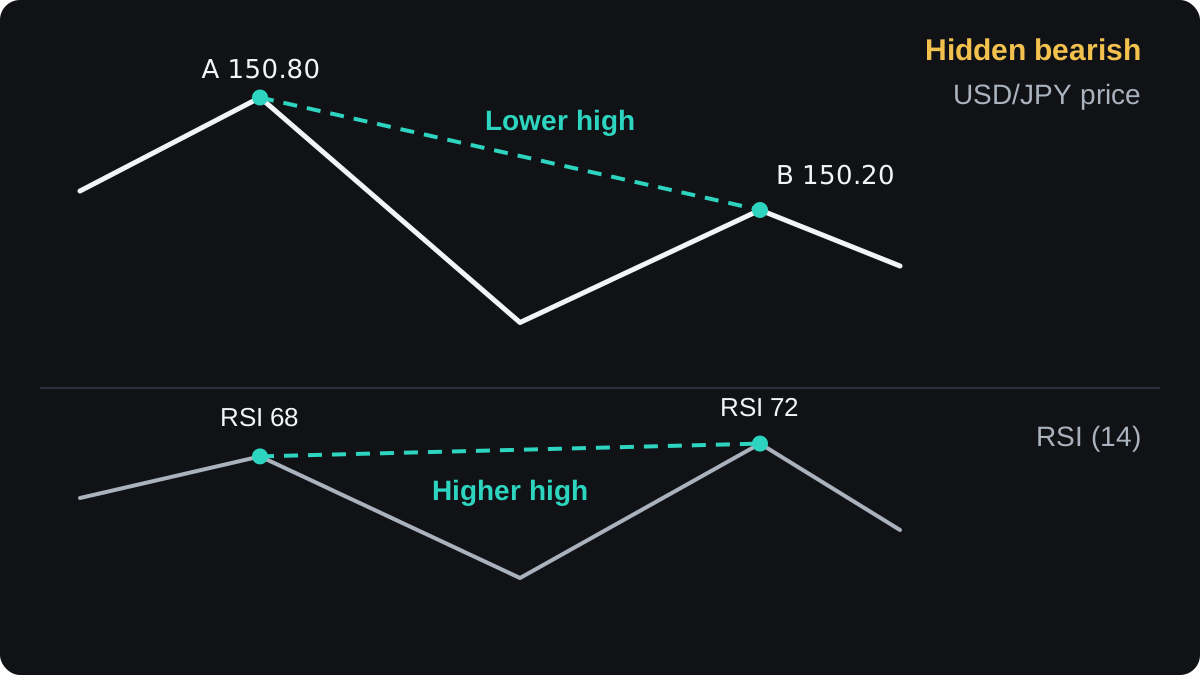
A hidden bearish divergence appears in a downtrend: price makes a lower high and the oscillator makes a higher high. It suggests sellers returned at a lower price than last time, so the downtrend may resume.
The four kinds of divergence compare like this:
| Type | Trend | Price | Oscillator | What it hints at |
|---|---|---|---|---|
| Regular bullish | Downtrend | Lower low | Higher low | Possible turn up |
| Regular bearish | Uptrend | Higher high | Lower high | Possible turn down |
| Hidden bullish | Uptrend | Higher low | Lower low | Uptrend may continue |
| Hidden bearish | Downtrend | Lower high | Higher high | Downtrend may continue |
Say USD/JPY is falling. It bounces to a high A at 150.80 with the RSI at 68, drops, then bounces again to a high B at 150.20 with the RSI at 72.
High B sits 0.60 below A. A pip on a yen pair is 0.01, so that is 60 pips. Price made a lower high while the RSI made a higher high, which is hidden bearish divergence.
Why can an oscillator dip while price holds up?
The RSI compares the average size of recent up moves with recent down moves, by default over 14 bars. It reacts to the size and speed of those moves and ignores the price level itself.
A pullback that is sharp and short can push the RSI lower than a slower decline did earlier. Price stays above the old low, while the reading drops below the old reading.
So hidden bullish divergence records that the latest pullback carried more downward momentum than the last one, yet price still stopped higher. That is a fact about past bars. Whether buyers keep defending the trend is a separate question the indicator cannot answer.
The same test works on the MACD histogram or a stochastic oscillator. Each tool can show divergence on different swings, so choose one with fixed settings and compare like with like.
A worked example on EUR/USD
Suppose a trading plan treats hidden bullish divergence as a reason to look for a buy, and only inside an established uptrend. The trade below shows how the numbers fit together and is no recommendation to trade.
- Confirm the trend. Price has made higher highs and higher lows, with a swing high at 1.09300 between lows A and B.
- Spot the divergence. Low B at 1.08600 is above low A at 1.08200, while the RSI fell from 32 to 28.
- Wait for confirmation. Low B only counts as a swing low once price rises away from it. Here the buy happens when price climbs back to 1.08700.
- Place the stop below low B, at 1.08500. The distance is 1.08700 minus 1.08500 = 0.00200, or 20 pips.
- Set the target at the previous swing high, 1.09300. The distance is 1.09300 minus 1.08700 = 0.00600, or 60 pips.
- Size the position. With a $5,000 account and 1% risk, you can lose $50. One standard lot of EUR/USD is worth $10 a pip, so 20 pips cost $200 per lot, and $50 ÷ $200 = 0.25 lot.
- Check both outcomes. On 0.25 lot a pip is worth $2.50. The stop loses 20 × $2.50 = $50, and the target gains 60 × $2.50 = $150.
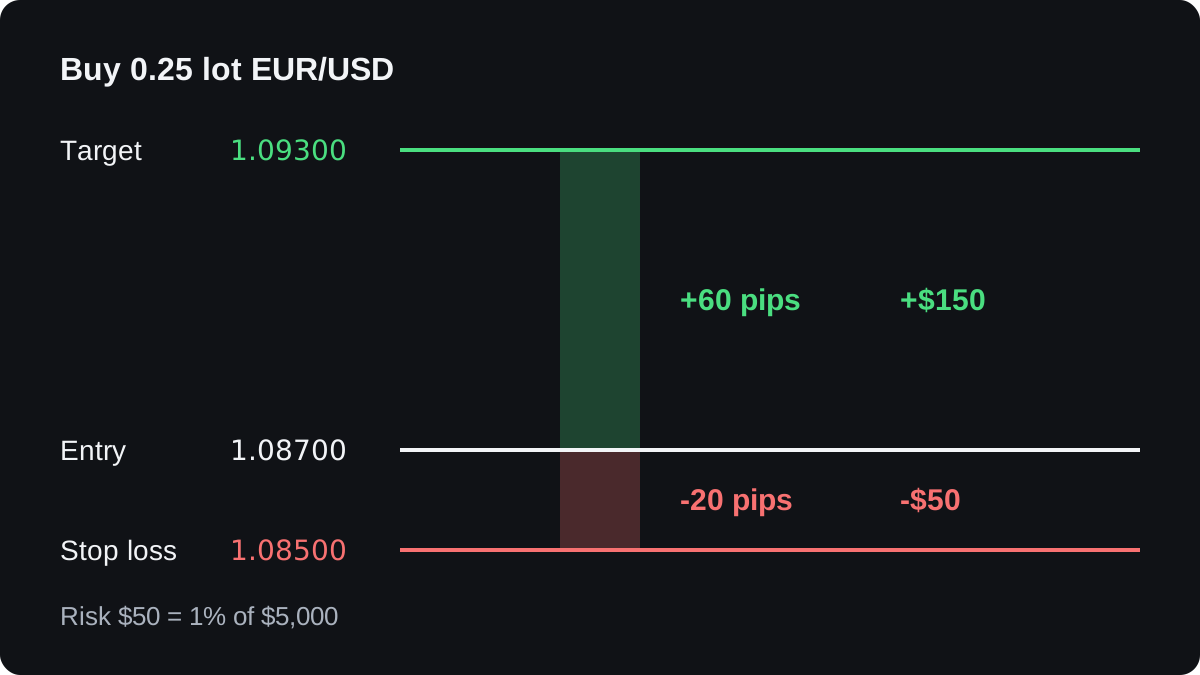
The reward is three times the risk, but that ratio says nothing about how often the target is reached. The sums also ignore spread and commission, which reduce every result.
Step 6 is the same method as in how to calculate position size. The divergence only suggests where to look, while the stop and the lot size set what you can lose.
Where hidden divergence fails
The trend can end anyway. A higher low with a weak RSI can come just before price drops through low B and then low A, and at that point the signal has simply been wrong.
You also see the pattern late. Low B becomes a swing low only after price has moved away from it, so part of the move is gone by the time the divergence is complete.
Picking swings is a judgement call. Two people can choose different lows on the same chart and disagree on whether divergence exists, and changing the RSI length from 14 to 9 can change the answer again.
Hidden divergence assumes there is a trend to continue. In a sideways market, higher lows and lower RSI readings carry little meaning, so check first whether the market is trending or ranging.
The evidence behind it is thin. Little independent, published testing shows it predicts continuation better than chance once costs are counted, so backtest any rule built on it before you rely on it.
The divergence cheat sheet puts regular and hidden divergence side by side for quick reference.
常見問題
What is the difference between regular and hidden divergence?
Regular divergence compares highs in an uptrend or lows in a downtrend and hints at a reversal. Hidden divergence compares lows in an uptrend or highs in a downtrend and hints that the trend may continue.
Which indicator is best for hidden divergence?
No indicator has been shown to be the best. RSI, MACD and the stochastic oscillator are common choices, and using one tool with fixed settings keeps your readings comparable.
Is hidden divergence reliable?
On its own it is a weak signal. It describes past momentum, fails whenever the trend ends, and has little independent evidence behind it, so test any rule on your own data first.
Does hidden divergence appear on all timeframes?
You can draw it on any timeframe. Shorter charts show more swings, so they produce more divergences to judge, and spread takes a bigger share of the small moves.
繼續學習
 第 4 章What is divergence?Divergence is when price and an indicator disagree. Price makes a new high or low, but an oscillator such as RSI or MACD does not make a matching one. It warns that the move is losing speed. It does not say when, or whether, price will turn, and it can last a long time.
 第 4 章Regular divergence.Regular divergence is when price and an oscillator disagree at a turning point. In the bearish case, price makes a higher high while the oscillator makes a lower high. In the bullish case, price makes a lower low while the oscillator makes a higher low. It warns that momentum is fading, though price can keep going.
 第 4 章Divergence cheat sheet.Divergence is a mismatch between price and an oscillator such as RSI. Regular divergence (price makes the new extreme, the indicator does not) hints that a trend may turn. Hidden divergence (the indicator makes the new extreme, price does not) hints that a trend may continue. Bullish types compare lows, bearish types compare highs. Neither is reliable alone.

